| GISdevelopment.net ---> AARS ---> ACRS 2004 ---> New Generation Sensors and Applications: New Generation Sensors |
Nonlinear Internal Waves in
the South China Sea
Ming-Kuang
Hsu
Professor, Kuang Wu Institute of Technology, Taipei, Taiwan, R.O.C.
E-mail: Hsumk@kwit.edu.tw
Antony K. Liu
Senior Scientist, NASA/Goddard Space Flight Center, Greenbelt, Maryland, U.S.A.
E-mail: Antony.A.Liu@nasa.gov
Professor, Kuang Wu Institute of Technology, Taipei, Taiwan, R.O.C.
E-mail: Hsumk@kwit.edu.tw
Antony K. Liu
Senior Scientist, NASA/Goddard Space Flight Center, Greenbelt, Maryland, U.S.A.
E-mail: Antony.A.Liu@nasa.gov
ABSTRACT
ENVISAT ASAR, RADARSAT-1 and ERS/2 SAR images have been used to study the internal waves in the north part of South China Sea (SCS). Based on the internal wave distribution map compiled from SAR images collected in the last 5 years, almost all internal waves in the SCS are propagating westward and are generated from the shallow topography or sills in the Luzon Strait. However, from ENVISAT ASAR images collected recently it shows no strong surface signature of internal wave near the sources region. More study on radar imaging mechanism for internal tides/waves near the generation area is needed. In the internal wave distribution map, the internal wave crest in the SCS can be as long as 200 km and the westward propagating huge well-developed internal solitons are often encountered and broken by the coral reefs on the shelf. In some cases, the broken waves will merge after passing the island and interact with each other. Also, the elevation internal wave and its induced re-suspension due to strong upwelling current in the shallow water (around 100 m depth) were detected by using shipboard echo-sounder EK500.
1. Introduction
The tidal flow over topographic features such as a sill or continental shelf in a stratified ocean can produce nonlinear internal waves of tidal frequency and has been studied by many investigators (Liu et al., 1985). Their observations provide insight into the internal wave generation process and explain the role they play in the transfer of energy from tide to ocean mixing. These nonlinear internal waves are apparently generated by internal turbulent mixing or baroclinic shear instability due to tidal flow over bottom features. It has been demonstrated that surface signatures of these nonlinear internal waves are observable in the SAR images from the First and Second European Remote sensing Satellite ERS-1/2 (Liang et al., 1995; Liu et al., 1998; Hsu, et al, 2000). The field experiments provide a unique opportunity to study the evolution of nonlinear internal waves and to validate imaging mechanism for SAR-observed internal wave signatures in the SCS. A validated and calibrated model can be very useful for understanding of shelf processes and for the applications of the internal wave effect on oil drilling platform, nutrient pump (for fishery) and sediment transport.
2. Nonlinear internal waves in the South China Sea
The Kuroshio moving north from Philippine Basin branches out near the south tip of Taiwan and part of the Kuroshio intrudes into the South China Sea through the Bashi Channel and the Luzon Strait. Surface signature of huge internal wave packets has been observed in the ERS-1/2 SAR images, RADARSAT-1 wide swath SAR and ENVISAT ASAR images.
Recently, the internal wave distribution map in the SCS have been compiled from hundreds of ERS-1/2, RADARSAT and Space Shuttle SAR images from 1993 to 1999 by Hsu et al. (2000) as shown in Figure 1 for reference.
Figure 1. The bathymetry and internal wave distribution in the South China Sea.
Based on internal wave distribution map, most of internal waves in the northeast part of SCS are propagating westward. The crest of soliton is more than 200 km long and each packet contains more than ten rank-ordered solitons with a packet width of 25 km. Within a wave packet, the wavelengths appear to be monotonically decreasing, front to rear, from 5 km to 500 m. In the SCS, internal wave amplitude larger than 100 m had been observed in the sea expeditions and mooring stations. These huge wave packets propagate and evolve into the SCS and finally reach the continental shelf of southern China.
Bole (Bole et al., 1994) suggested that the solitons are generated in a 4 km wide channel between Batan and Sabtang islands in Luzon Strait. The proposed generation mechanism is similar to the lee wave formation from a shallow topography in the Sulu Sea (Apel et al., 1985). The generation is caused by the semi-diurnal tide and the Kuroshio intrusion across the Luzon Strait. But, from ENVISAT ASAR (Fig. 2) images collected in 2003 show no strong surface signature of internal waves near the sources in these images as observed in Sulu sea (Hsu, et. al, 2003). Various generation mechanisms and SAR imaging algorithms of internal tides/waves are under investigation.
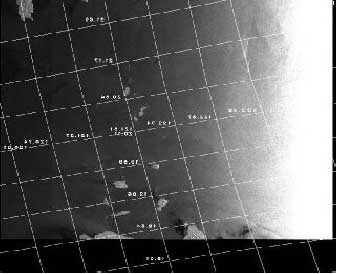
Figure 2. ENVISAT ASAR image in Luzon Strait, up-left is the south tip of Taiwan and lower part is Luzon island.
Both elevation internal waves and depression waves under various ocean conditions have been studied. The effects of water depth on the evolution of solitons and wave packets have been modeled by Kortweg-deVries (KdV)-type equation and linked to satellite image observations. The numerical results indicate that the depression internal waves evolve into rank-ordered solitons on the shelf with a shallow mixed layer. However, when the mixed layer is thicker than the bottom layer, only elevation waves can be evolved. Based on the SAR images and hydrographic data, internal waves of elevation type had been identified in shallow water due to a thicker mixed layer as compared with the bottom layer on the continental shelf (Fig.3).
Figure 3. Schematic diagram of depression and elevation internal waves, surfaces current field, wind waves, and the resultant SAR image intensity variations. (After Liu, et al., 1998).
3. SAR Observation
Depression internal waves have been observed in the ENVISAT ARAR image on August 13, 2003 near DongSha Island (Fig. 4). A huge internal solitons near DongSha Island with crest more than 200 km long and wave speed of 1.9 m/s. In early RADARSAT image (Hsu, and Liu, 2000) the depression waves were located in water of 500 m depth, while the elevation waves were in the area where water depth is less than 200 m. The depression internal waves change their polarity after passing through a “turning point” and became elevation internal wave packets in the shallow water (Fig. 3). The wave-wave interactions have been observed in many SAR images of the South China Seas (Hsu and Liu, 2000). The internal solitons are nonlinear, thus their interaction are much more complicated than the regular linear waves. Based on the SAR images, near DongSha Island, the westward propagating huge internal solitons are often encountered and diffracted/broken by the coral reefs on the shelf and then interact with each other and re-merge as a single wave packet. After the nonlinear wave-wave interaction, the phase of wave packet is shifted and wavelength is also changed in the South China Sea.
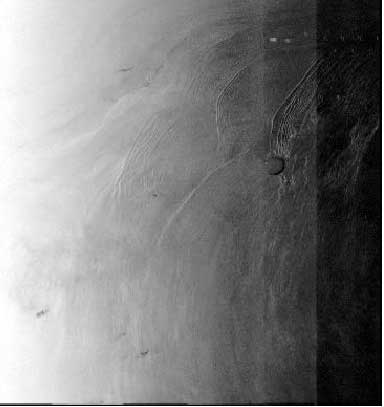
Figure 4. ENVISAT ASAR image collected north of the South China Sea on August 13, 2003, showing at least 3 packets of internal waves. The internal wave packets propagate toward the Dongsha coral reefs, and are diffracted by Dongsha coral reefs into two wave packets, and then interact with each other and re-merge as a single wave packet.
A T-string mooring had been deployed northeast of Dongsha Island (2003/4/16) to collect the temperature fluctuations (Fig. 5). For comparison, the ERS-2 SAR image collected at the same day processed at Taiwan Ground Station is shown in Figure 6. This huge soliton of 70 m amplitude in the temperature contour diagram is consistent with the observation in ERS-2 SAR image both in time and location.
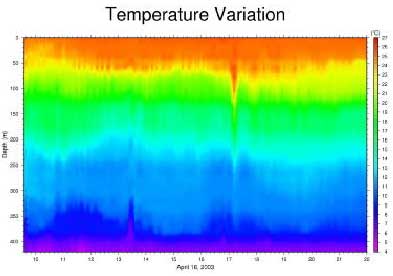
Figure 5. Temperature fluctuations when internal wave pass the mooring station northeast of Dongsha Island.
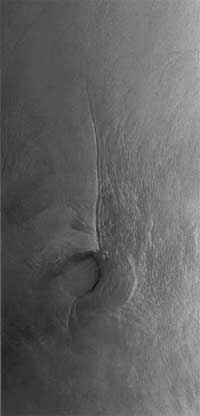
Figure 6. ERS-2 SAR image obtained on 2003/4/16 near DongSha Island
During the field experiment, the echo-sounder EK500 onboard was used to track the solitons when research ship passed over the soliton packet. By using EK500 we have confirmed the existence of elevation internal waves in the shallow water area. One of the most interesting processes is the finding of the sediment re-suspension (shown in red color) in elevation internal wave (shown in green color) active area as shown in Figure 7. More field experiments are required and planned, in order to collect enough data for detailed analysis and model simulation.
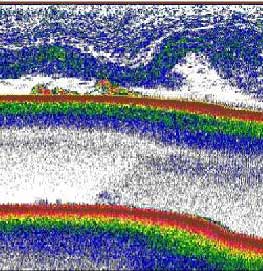
Figure 7. Sediment re-suspended by the strong current generated by the elevation internal waves in the shallow water area.
Acknowledgements
The authors would like to thank the European Space Agency for providing ENVISAT ASAR and ERS-1/2 SAR images (copyright to ESA) and the Canadian Space Agency for providing RADARSAT images through ADRO program (copyright to CSA). This research is supported by the National Science Council’s research grant (NSC92-2611-M-019-004).
References
- Bole, J. B., C. C. Ebbesmeyer, and R. D. Romea, Soliton currents in the South China Sea: measurements and theoretical modeling, Offshore Technology Conference, OTC 7417, 367-376, 1994.
- Hsu, M. K., and A. K. Liu, Nonlinear internal waves in the South China Sea, Canadian Journal Remote Sensing, April, 2000.
- Hsu, M. K., A. K. Liu and C. Liu, A study of internal waves in the China Seas and Yellow Sea using SAR. Continental Shelf Research, 20, 389-410, 2000.
- Liang, N. K., A. K. Liu, and C. Y. Peng, A preliminary study of SAR imagery on Taiwan coastal water. Acta Oceanogr. Taiwanica 34, 17-28, 1995.
- Liu, A. K., Analysis of nonlinear internal waves in the New York Bight. J. Geophys. Res. 93, 12317-12329, 1988.
- Liu, A. K., J. R. Apel, and J. R. Holbrook, Nonlinear internal wave evolution in the Sulu Sea. J. Phys. Oceanogr. 15, 1613-1624, 1985.
- Liu, A. K., Y. S. Chang, M. K. Hsu and N. K. Liang, Evolution of nonlinear internal waves in the East and South China Seas. J. Geophys. Res. 103, 7995-8008, 1998.
- Liu A. K. and M. K., Hsu, “Internal wave study in the South China Sea using synthetic aperture radar (SAR)”, Int. J. Remote Sensing, 25, 1261-64, 2004.