| GISdevelopment.net ---> AARS ---> ACRS 2004 ---> New Generation Sensors and Applications: New Generation Sensors |
Evaluation of water stress on
a crop using the portable hyper spectral imager
Hidetomo FUJIWARA, Takahiro
ENDO, Yoshifumi YASUOKA
Institute of Industrial Science
University of Tokyo
4-6-1 Komaba, Meguro-ku, Tokyo, Japan, 153-8505
Tel: +81-3-5452-6415 FAX : +81-3-5452-6410
E-mail: hidetomo@iis.u-tokyo.ac.jp
Institute of Industrial Science
University of Tokyo
4-6-1 Komaba, Meguro-ku, Tokyo, Japan, 153-8505
Tel: +81-3-5452-6415 FAX : +81-3-5452-6410
E-mail: hidetomo@iis.u-tokyo.ac.jp
Abstract
We measured changes of spectral characteristics from crops water stress in different scales of leaf and plants by using the portable hyper spectral imager which had high spatial and spectral resolution. Our research object is to evaluate of water stress on the basis of experiments. The vegetation of our experiment is soybeans. Our plantation crop had been divided into two groups, one with enough water for growth and the other under water stress. Measurements of soil water, water potential and SPAD value has been done to relate these parameters. From the measurements, it is found that, spectral sensitivity due to water stress had been found be highest in the near infrared region as high correlation was found between SPAD value and spectral change in this region.
1. Introduction
Crop failure due to water stress is an important problem needing adequate research attention as it has been found that the sixty percent of crop damages is from water stress. Remote sensing has been found to have good potential in mapping water stress from for better managerial decision making. With its synoptic and regular temporal capability, we think remote sensing can be quite effective in early detection and forecasting of crops failure. Past researches about water stress are concentrated mostly on a certain scale and doesn’t relate the results in different scales of leaf, plants and vegetation in a forward manner. In this research, we measured changes of spectral characteristics from crops water stress in different scales of leaf, plants and vegetations by using the portable hyper spectral imager which had high spatial and spectral resolution. Our research object is to evaluate of water stress on the basis of experiments. The vegetation of our experiment is soybeans as it is one of the demanded crops in the world. Our plantation crop has been divided into two groups, one with enough water for growth and the other under water stress. Measurements of soil water, water potential and SPAD value’ which is spectral signal from the vegetation’ has been done to relate these parameters. From the measurements, it is found that, spectral sensitivity due to water stress has been found be highest in the near infrared region as high correlation is found between SPAD value ‘direct measurement’ and spectral change ‘indirect measurement’ in this region.
2.Study area and experiment
This research study area is Field Production Science Center in the University of Tokyo, Tanashi city, Tokyo. This area has warm moisture climate.
We adopted following experiment for direct measurement to vegetation. Amount of soil water was measured by Profile Probe type PR1 [Delta-T Devices Ltd, Cambridge, UK], SPAD value by SPAD-502 [Minolta Camera Co., Osaka, Japan], maximum water potential by Model 670 pressure chamber instrument [PMS Instrument Co., USA].
For indirect measurement, hyperspectral imeger which was developed by Yasuoka lab, University of Tokyo was adopted. Specification of this imeger is shown in Figure 1,Figure 2.
Fig. 1. Specification of Hyperspectral imager
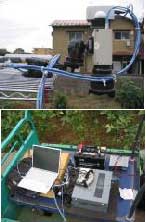
Fig. 2. Hyperspectral imeger
3.Methodology
The method of evaluation of water stress is described in this section. Figure 3 shows this research flow. In this research, we set up two cases for detecting spectrum of vegetation water stress. One case is given water stress by replant and non-water. Another case is not given by affusion which is giving water.
Measurement is done every hour, total 4 hours.
Fig.3. Research flow
4. Result of discussion
Following is result of discussion in this research several measurement.
4.1 Decision of subject vegetation
We adopted soybeans subject vegetation, which is one of the important foods for farm animal and human being. Breed for use was ENREI which is more commonly used in the world. Start of experiment, giving water stress, was decided on the time. It is the time which soybeans had constant leaves number and height. The time had come in same number leaves of coming out and number of falling leaves, and height. Figure 4 show the result of leaves number and height.
Fig.4. Leaves number and Heght
4.2 Measurement of amount of soil water
Vegetation mainly gets water with their root. Since, Different of amount of soil water affected to detection of water stress in direct measurement and indirect measurement. When we measured soil water at underground 100mm, 200mm in setting case. One case, which was given water stress, 285.7mV (100mm )303.3mV (200mm ), the another case was 344.7mV (100mm ) 370.7mV (200mm ).
In this research, soil water value was not almost change. Because measurement time was very short, 4 hours.
4.3 Measurement of Maximum water potential
Pressure chamber method is done to measure vegetation water stress quantitatively. Maximum water potential was gotten by this method. These results are shown in Figure 5. Case1 was given water stress. Case2 was not given. Case1 was shown that SPAD value increased as time goes by. Maximum water potential was value of measurement times minus one.
4.4 Measurement of SPAD value
SPAD value was measured to detect vegetation condition, which was amount of chlorophyll. Chlorophyll amount is one of import index. These results are shown in Figure 5. When SPAD value increased, amount of chlorophyll per unit area ordinarily increased too.
Fig. 5. Maximum water potential and SPAD value
However, in this research, we thought amount of chlorophyll per unit area didn’t increase. Because, since measurement time is very short, construction of these chlorophylls were changed by decreasing leaf water. Figure 6 shows these changes.
Fig. 6. Construction of inner leaf
4.5 Measurement of Hyperspectral imeger
Measurement of Hyperspectral imeger was done in same time with any other measurement. This experiment can do 2Dimension measurement which was impossible before a time.
Figure 7 shows average spectrum which is calculated by result of supervised classification. Maximum value of near-infrared range was 35.7% at start time, 52.7% after one hour, 64.2% after two hour, 56.5% after four hour. This result related to SPAD value. Figure 8 is Hyperspectral image.
Fig.7. Reflectance
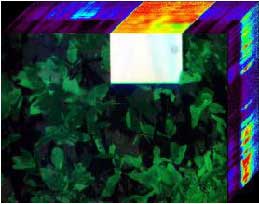
Fig.8. Hyperspectral Image data
5.Conclutions
We made it appear relation soil water, Maximum water potential, which is measured by direct measurement, and spectrum change, which by indirect measurement, And more, correlation SPAD value and Maximum spectrum value.
Future works is that we should appear relation water stress and spectrum change in extended period of time. And should make water stress estimation model with this data.
References
- Hiroshi NONAMI, 2001. Water Relations in Plant Physiology Yokendo Ltd.
- Takahiro ENDO, Toshinori OKUDA ,Masayuki TAMURA and Yoshifumi Yasuoka, 2000. Estimation of Photosynthetic rate of plant from hyperspectral remote sensing of biochemical content. The proceedings of The 21st Asian conference on Remote Sensing, pp.815-820.