| GISdevelopment.net ---> AARS ---> ACRS 2004 ---> New Generation Sensors and Applications: LiDAR |
Structuralization of LiDAR
Point Cloud
Shing-Hung Lin* Jen-Jer
Jaw**
Department of Civil Engineering, National Taiwan University
1 Roosevelt Rd. Sec. 4, Taipei, 10617, Taiwan, R.O.C.
**Tel: 886-2-23678645, **Fax: 886-2-23631558
*Email: poa@vip.url.com.tw, **jejaw@ce.ntu.edu.tw
Department of Civil Engineering, National Taiwan University
1 Roosevelt Rd. Sec. 4, Taipei, 10617, Taiwan, R.O.C.
**Tel: 886-2-23678645, **Fax: 886-2-23631558
*Email: poa@vip.url.com.tw, **jejaw@ce.ntu.edu.tw
ABSTRACT
Inherited from the data acquisition nature, LIDAR point cloud are of random distribution rendered with geometric 3-D coordinates as well as radiometric intensities. To infer from LIDAR point cloud for explicit information in object space, further processes must be carried out. The authors investigated in this study by exploiting the concept of structuralization on LIDAR point cloud where the following subjects were targeted: (1) tabling the LIDAR point cloud attributed with geometric, radiometric information and topologic relationship of the points within near neighborhood; (2) classifying the point cloud into planar and isolated points by iterative validation through geometric and radiometric inference; (3) outlining the plane boundary; (4) deriving and localizing 3-D line and corner features by intersecting neighboring planes. The resultant features, including planes, 3-D lines, and corners from the proposed processing procedures are advantageous for the purposes of object reconstruction and other photogrammetric applications.
1 INTRODUCTION
LIDAR system emerging as an effective tool for 3-D data acquisition in photogrammetric community can be originated from the research of Lindenberger (1993) who investigated and implemented a laser-profiling system for topographic mapping. The technology soon advances to LIDAR systems which allow rapid 3-D point cloud acquisition with along and across the flying track within the past decade. With the direct geo-referencing and canopy penetrating capabilities, airborne and ground-based LIDAR systems are favored in versatile applications, including coast and power line mapping, forest inventory, digital elevation models (DEM) and digital surface models (DSM), 3-D city modeling, and being an effective part of hazards mitigation systems, etc. Due to the discrete nature of LIDAR point cloud, certain operations need to be processed before any object features can be identified and thus utilized. Processing LIDAR point cloud by the concept of structuralization becomes a hot research topic for extracting higher level features, such as 3-D lines, planes, and objects. An excellent review of structuralization can be referred to Sarkar and Boyer (1993) who later gave an insight into 3-D data structuralization. (Boyer and Sarkar, 1999). Lee (2002) employed “Perceptual Organization” for discriminating objects from ground structures. A recent work of segmenting and classifying LIDAR data by using octree structure can be referred to Wang and Tseng (2004).
In this study, the authors aims at extracting 3-D features from LIDAR point cloud by following the procedures of patch growing, plane hypothesizing, plane validation, planes grouping, and 3-D line intersection. The processing chain iterates itself until no further information can be verified. An attribute table offering geometric inference and verification is the key component to the success of data processing.
2 METHODOLOGIES
The structuralization of LIDAR point cloud starts with plane hypothesis which is supported by patch by patch segmentation. A table recorded with geometric and topological attributes on a patch basis is used for all processes. The detailed procedures for structuring LIDAR point cloud can be seen through the following sub-sections.
2.1 Attributes tabling
A patch is constituted by hypothesizing a plane around a given LIDAR seed point. The resultant plane fitting (seed point excluded), accompanied by estimated plane parameters, estimated plane accuracy, and the normal distance from seed point to the fitting plane, are recorded in the attribute table which is used then for grouping patches into plane or hypothesizing isolated and (near) corner points. Two typical types of LIDAR point listed below are in great potential to be identified:
(1) Points near to the edge (Figure 2-1a and b): behaved with unsatisfied plane fitting (namely an inaccurate plane) and significantly large normal distance.
(2) Isolated points (Figure 2-1c): featured by plane fitting with satisfaction while rendering large normal distance.
Figure 2-1, Identifiable points, (a) point near edge, (b) corner point, (c) isolated point.
2.2 Geometric inference
To group the patches, the angle of associated plane normal vectors ( 1 n . and 2 n .) are calculated and an angle threshold is applied for determining whether or not the investigated patches are coplanar. The plane hypothesis will only be successful by further checking the orthogonality of normal vector to the vector (p .) linking two seed points in addition to the above angle examination. The designed algorithms bring about the following inferences:
(1) Non-coplanar patches (Figure 2-2a): 1 n . and 2 n .are not significantly parallel.
(2)Coplanar patches (Figure 2-2b): 1 n . and 2 n . are significantly parallel and 1 n . is perpendicular to p ..
(3) Parallel but not coplanar patches (Figure 2-2c): 1 n . and 2 n . are significantly parallel but 1 n . is not perpendicular to p ..
Figure 2-2, Geometric inference of patches, (a) non-coplanar patches, (b) coplanar patches, (c) parallel but not coplanar patches.
2.3 Iterative structuralization
The plane hypotheses by afore-mentioned approaches may lead to incomplete and sometimes incorrect plane formation. The output of each run of structuralization is regarded as only an approximation towards final product. The processing chain iterates itself for geometric inference and validation until no further update can be identified. Accurate corner points and 3-D line intersection can be derived based on resultant planes then.
2.4 Human intervention
As an intermediate stage for verifying the result and imposing editing for further refinement which can not be achieved by current system, human intervention may improve the result that suits the expectation. An interactive environment for providing the operational flexibility in promoting the automatic result is available along with the automatic system for structuralizing LIDAR point cloud in this work.
The proposed structuralization system for LIDAR point cloud is illustrated in Figure 2-3.
Figure 2-3 Proposed structuralization system
3 EXPERIMENTS AND RESULTS
Two data sets, simulated LIDAR point cloud (experiment_1) and ground-based LIDAR (experiment_2) by Optech ILRIS-3D instrument, are used to demonstrate the effectiveness of proposed system.
3.1 Experiment_1: Simulated data
Simulated LIDAR point cloud, shown as Figure 3-1a, provide two neighboring planes and an isolated point. To mimic the random property of LIDAR data, a s=0.1m noise has been added on each Z component. The intermediate output during the iterative structuralization can be seen from Figure 3-1b through 3-1d. The results illustrate the successful structuralization of LIDAR point cloud by identifying an isolated point, formulating planes, and deriving a 3-D line.
Figure 3-1 Structuralization in simulated LIDAR point cloud, (a)simulated LIDAR point cloud (noised), (b)intermediate result of hypothesizing three planes (with different colors) and a isolated point, (c) intermediate result of hypothesizing three planes with refined grouping near edge, (d) final results showing successful plane grouping, isolated point detection, and 3-D line derivation.
3.2 Experiment_2: Ground-based LIDAR point cloud
The test site for experiment_2 is indicated within a rectangle in Figure 3-2a. The interval of neighboring LIDAR points is 1cm by 1cm in average while the LIDAR point positioning accuracy is reportedly 8~12mm for three components. The LIDAR point cloud and the intermediate results are shown in Figure 3-2b through 3-2e with human intervention following the structuralized result that shows in Figure 3-2d.
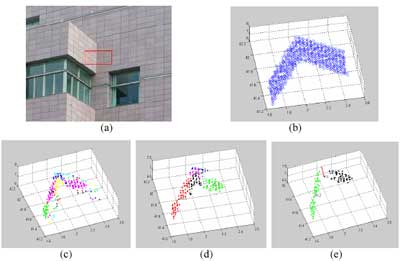
Figure 3-2, Structuralization in ground-based LIDAR point cloud, (a) a rectangle in the image indicates the test area, (b) LIDAR point cloud, (c) intermediate result of patch growing, (d) intermediate result of plane hypotheses, (e) final result obtained by human intervention for merging neighboring planes and an automatic 3-D line derivation followed.
The resultant structuralization for features (planes and derived 3-D line) can be quantitatively evaluated via numerical analysis on parameters and their uncertainties (Table 3-1).
* (A1, B1, C1) is adopted from the definition of plane by A1X+B1Y+C1Z+1=0
** Four parameter representation of 3-D line, where (a,b,1) represents the directional vector
while (p,q,0) is the penetration point of 3-D line on X-Y plane (Habib et al., 2000). Based on the results revealed from Figure 3-2, two planes are successfully grouped and the 3-D line is derived. The human intervention appears necessary and a great help for more complete plane formulation. The variance components in Table 3-1 identify the discrepancy of plane formulation compatible with LIDAR point errors, offering an alternative for evaluating LIDAR accuracies should they are not precisely known. The availability of parameters and their uncertainties are indispensable for later usage especially when fusing data sets coming from different sensors where individual accuracy determines the relative fusion power.
4 CONCLUSIONS
This study identifies the proposed structuralization system with effective plane segmentation and 3-D line derivation with human intervention whenever necessary. The system proceeds with reasonable output verified by visual inspection and the variance component through adjustment computation gives internal accuracy which matches quite with LIDAR point errors. On the other hand, geometric feature properties need further verification via comparing with higher accurate measurements. In addition, improving the efficiency of current system is suggested for following aspects:
- Exploiting the LIDAR intensity information onto the structuralization process.
- Promoting the computational efficiency.
- Maximizing the system efficiency by balancing automatic processes with human intervention.
The authors would like to express the most sincere thanks to Prof. Yi-Hsing Tseng at national Chung-Kung university for providing ground-based LIDAR data set. And the funding granted from National Science Council, ROC under the project “NSC 93-2211-E-002-054” is also greatly appreciated.
REFFERENCES
- Boyer, K.L. and S. Sarkar, 1999. Perceptual organization in computer vision: status, challenges, and potential, Computer Vision and Image Understanding 76(1), pp.1-5.
- Habib, A., A. Asmamaw, D. Kelly, and M. May, 2000. Linear Features in Photogrammetry, Report No. 450, Department of Civil & Environmental Engineering & Geodetic Science, The Ohio State University, Columbus, OH, pp.22-25.
- Lee, I, 2002. Perceptual Organization of Surfaces, Ph.D. dissertation, Graduate Program in Geodetic Science and Surveying, The Ohio State University, Columbus, OH, USA, 159p.
- Lindenberge, J., 1993. Laser-Profilmessungen zur topographischen Geländdeaufnahme, Ph.D. dissertation, Deutsche Geodätische Kommission, Reihe C, Heft 400, Munich, 131p.
- Sarkar, S. and K.L. Boyer, 1993. Perceptual organization in computer vision: a review and a proposal for a classificatory structure, IEEE Transactions on Systems, Man and Cybermetrics, 23(2), pp.382-399.
- Wang, M. and Y.H. Tseng, 2004. LIDAR data Segmentation and Classification based on Octree Structure, The proceedings of the XXth Congress of ISPRS, Vol. XXXV, Part B3, pp.308-313.