| GISdevelopment.net ---> AARS ---> ACRS 2004 ---> New Generation Sensors and Applications: LiDAR |
A Method for counting
pedestrians using a Laser Range Scanner
Kyoichiro Katabira,
Katsuyuki Nakamura, Huijing Zhao, Ryosuke Shibasaki
Center for Spatial Information Science, The University of Tokyo, JAPAN
Tel: +81-3-5452-6412, fax: +81-3-5452-6414
Email: katabira@iis.u-tokyo.ac.jp, katsu@iis.u-tokyo.ac.jp, chou@paddy.iis.u-tokyo.ac.jp, shiba@paddy.iis.u-tokyo.ac.jp
Center for Spatial Information Science, The University of Tokyo, JAPAN
Tel: +81-3-5452-6412, fax: +81-3-5452-6414
Email: katabira@iis.u-tokyo.ac.jp, katsu@iis.u-tokyo.ac.jp, chou@paddy.iis.u-tokyo.ac.jp, shiba@paddy.iis.u-tokyo.ac.jp
ABSTRACT
Video-based approaches have been studied for decades in order to count passing people. However, these methods can be successfully applied only when the cameras can be located at such a good position that they can collectively minimize occlusions and can cover an entire area with sufficient resolution. In addition, image processing algorithm for counting people using a video camera has not yet overcome the difficulties such as high computational costs, occlusions by the dense pedestrians. Except when only smaller numbers of people pass through the gate at the same time, the video-based methods are difficult to count the pedestrians very accurately in a relatively larger space. In this paper, we propose a method of counting pedestrians using a laser range scanner. A laser range scanner is mounted on the ceiling of a passage, and scans vertically keeping the scanning plane orthogonal to the major passage direction, i.e. the laser beam scans the passage like a curtain. We can obtain the height values of passing people with the laser scanner with 37.5 Hz frequency. The height data from the laser scanner fluctuates as the pedestrians passed there. Furthermore, even if the multiple pedestrians are passing simultaneously, the laser range scanner can discriminate the human shapes individually because of a high angle-resolution. Accordingly, even if the density of pedestrians is so high, we can count the number of passing people accurately by counting the fluctuant laser range data or height values. An experiment was conducted in a railway station in Japan, which was used by 250,000 passengers a day, and in the observation site, the passing pedestrians were about 240 passengers per minute in the rush hour. Through the experiment, the performance of the laser-scanner- based counting system was demonstrated.
1. INTRODUCTION
Analyzing or monitoring human activities, such as counting the number of passengers, or measuring their trajectories, is considered very useful in various fields such as building security, planning and management support for shopping mall, railway station and so on. So far, motion analysis and counting pedestrians with video data has been a major method. Video-based systems for people counting over time and detecting overcrowded situations in underground railway stations were described in (Regazzoni and Tesei, 1996). A lift aiding system by counting the number of passengers waiting at each floor was developed in (Schofield et al., 1997). In order to reduce occlusions, video cameras have to be carefully located due to limited viewing angles and resolutions. For video-based surveillance, the change of illumination and weather conditions can be one of the major obstacles to its reliabilities. On the other hand, laser range scanner (briefly called “laser scanner” in the followings) using eye-safe laser have been successfully applied through many research efforts to improve efficiency and reliability in obtaining object geometry and detecting suspicious persons. In recent years, single-row type laser scanner with high scanning rate, wide viewing angle and long-range distance has been developed, and can be bought with rather low price on market. In this research, we propose a method of counting pedestrians automatically using a laser scanner. The experiment was conducted in a railway station in Japan, which was used by 250,000 passengers a day, and in the observation site, the passing pedestrians were about 240 passengers per minute in the rush hour. The results are compared with the number of pedestrians counting by visual observation with the height data.
2. METHODS
2.1 Outline of the Sensor
Single-row type laser scanner produced by SICK corp. is employed. It can measure range distances from the sensor to surrounding objects using “time-of-flight”. Laser scanner has the advantages of direct measurement, high accuracy (average distance error is 4cm), wide viewing angle (180 degree) and long range-distance (maximum range distance of 30m). Moreover, it has high angle-resolution of 0.5 degree because of a little diffusion of laser beam. Namely, we can obtain the 361 points data from 0 degree to 180 degree per one scan. Frequency is 37.5 Hz and wavelength of laser beam is 905 nm (near-infrared).
In this research, the sensor is mounted on the ceiling of a passage in a railway station shown in Figure 1, and its scanning direction is vertical to the floor and orthogonal to the passage direction. The laser beam scans the passage like a curtain (Figure 2, 3).

Figure 1. Mounted laser sensor
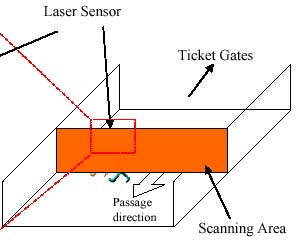
Figure 2. Aspect of the laser scanning
2.2 Counting Algorithm
When pedestrians pass though the scanning area of the laser scanner, sensor can acquire the range data from the sensor to the human head or shoulder. Consequently, we can obtain human shapes by transforming the data to x-z plane (Figure 4). Furthermore, by adding a time-axis, we can visualize the data as 3D image (Figure 5).
Next, we correct the shapes such as tilt or wall. When one frame is read, prominent object higher than the surrounding ones is searched. We define this threshold as 1m, and regard them as pedestrians. After that, the height data are searched continuously. If a prominent object is detected, it is considered as a passing pedestrian through the place. The conditions for counting as a “new” pedestrian are as follows. (1) The new prominent object does not exist within the shoulder width (0.8m) of the other prominent objects already recognized as pedestrians, (2) the prominent object does not exist near the objects recognized as pedestrians in the previous frame, and (3) in the some previous frames, pedestrian do not passed in the vicinity of the searched position at present. When the above conditions are satisfied, we regard as that a “new” pedestrian has passed, and count it. These processes, reading the height data in one frame (361 points) and counting the passing pedestrians with this algorithm, are repeated sequentially.
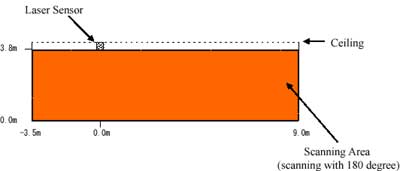
Figure 3. Aspect of the laser curtain
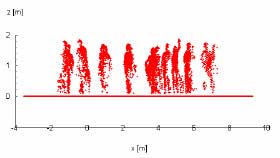
Figure 4. The laser data transformed to x-z plane
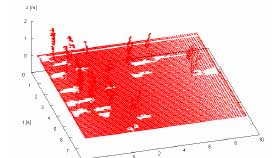
Figure 5. 3D (x-z-t axis) image
2.3 Accuracy Assessment
We assess the accuracy of this counting system as follows: success rate = (the number of passed pedestrians - the number of failed counting) / (the number of passed pedestrians). Failed counting is defined as follows: (1) two pedestrians are counted as one pedestrian, (2) one pedestrian is counted as two pedestrians, and (3) pedestrians are not counted. To assess the differences of accuracy by degree of crowds, we calculate the success rate as three situations: least crowded or uncrowded situation (150 or less pedestrians passed per a minute), moderately crowded situation (from 150 to 250 pedestrians passed per a minute), and highly crowded of overcrowded situation (250 or more pedestrians passed per a minute).
Figure 6. Counting algorithm
3. EXPERIMENT
The experiment is conducted at the concourse of a railway station, which has a dimension of 30m by 20m. The sensor is controlled by a computer, which is physically connected by 10/100 Base LAN. The passage has the ceiling of about 3.8m height and 12.5m width The sensor is mounted on 3.5m away from one side of walls. Another wall stays 9.0m away from the sensor. About 250,000 passengers a day used this station, and in the observation site, the passing pedestrians are about 240 passengers per minute in the rush hour. Rush hour is morning (8:00- 9:00) and evening (approximately 18:00).
4. RESULTS
We developed a system to display the height data like a DEM image and count pedestrians (Figure 9). The vertical axis corresponds to the time axis. When one frame is read, the image is scrolled down. When pedestrians are recognized, they are framed in by circle. By this system, we could count passing pedestrians. We calculated the counting accuracy according to three situations of crowds (Table 1).
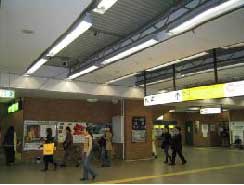
Figure 7. Aspect of the experiment site

Figure 8. Layout of the laser scanner and experiment site on a railway station
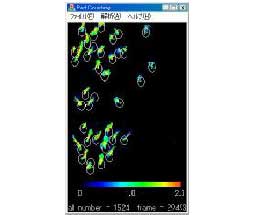
Figure 9. Display and counting system
We could find the counting accuracy was dependent on the human shapes obtained from height data rather than the degree of crowds. The failure cases were that one human shape had two prominent objects (Figure 10), a number of pedestrians walked very closely (Figure 11), and the pedestrian stopped in the laser curtain (Figure 12). However, according to height threshold and shoulder width, it might succeed to count. Even if the pedestrian had passed aslant, when the human shape was continuously, we could count with sufficient accuracy (Figure 13).
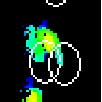
Figure 10. A pedestrian counted as two pedestrians
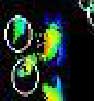
Figure 11. Uncounted pedestrian
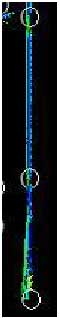
Figure 12. Pedestrian who has stopped at the laser curtain
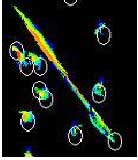
Figure 13. Pedestrian who has passed aslant
5. CONCLUSION
In this paper, we proposed a method of pedestrian counting using a laser scanner. Proposed method could count pedestrians with approximately 91% accuracy. The counting accuracy was dependent on the human shapes of the height data rather than the degree of crowds. Consequently, in the overcrowded situation, the counting accuracy seldom fell down. In the future works, we will improve the counting algorithm not to depend on the human shapes, reduce the failed counting, and find the passing direction.
REFERENCES
- K.Hashimoto, et al., 1998. People-counting system using multisensing application, Sensors and Actuators, A66, pp.50-55.
- Regazzoni, C.S., A.Tesei, 1996. Distributed data fusion for real-time crowding estimation, Signal Processing, vol.53, pp.47-63.
- Schofield, T.J.Stonham, A.J., P.A.Mehta, 1997. Automated people counting to aid lift control, Automation in Construction, vol.6, pp.437-445.