| GISdevelopment.net ---> AARS ---> ACRS 2004 ---> Data Processing: Image Classification |
Application of GIS &
Remote Sensing Data in monitoring of plantation in the projected forests
of Barak Basin, Manipur
Dr. R.K.
Chingkhei
Department of Earth Sciences, Manipur University, Imphal 795 003, Manipur, India,
Telephone No. - 91-0385-2221695, 2435173
Email: d_chingkhei@yahoo.co.in
Department of Earth Sciences, Manipur University, Imphal 795 003, Manipur, India,
Telephone No. - 91-0385-2221695, 2435173
Email: d_chingkhei@yahoo.co.in
ABSTRACT
Barak River with its tributaries is the second largest in the NE India and constitutes a part of Ganga-Brahmaputra water resource region. The major portion of the upper catchment is a hilly terrain with medium to degraded vegetation. State Forest Department has notified most of the Protected Forests in the subwatersheds 3C2D5, 3C2E3, 3C2E4 and 3C2E5 in the Barak Basin. The studies aimed to identify and assess the forest plantation and monitor the temporal vegetation changes in these subwatersheds. In the present studies, the application of digital image processing techniques has been used in identification of forest plantation sites in the protected forests area. Out of the various options of classification available in ERDAS Imagine, the Subpixel Classification of IRS I-C LISS III satellite data was adopted to identify the plantation sites. The total area of plantation in protected forest is approximately 20 km 2 , the age of plantation is approximately 25 yrs and the size of their stem is >1.5ft diameters. The monitoring of forest plantation sites has become essential to create a database for the State Forest Department and also to bring about a general awareness among the people.
1. INTRODUCTION
The northeastern region of India in general and Manipur in particular, endowed with rich and diverse forest cover, are under severe threat from population explosion, over exploitation of forest produces, unscientific felling of trees, encroachment of forest land, shifting cultivation practices etc. Forests of this region, which are unique in structure and species composition, exhibit a meeting zone of the temperate East Himalayan flora, Palaeo-Artic flora of Tibetan Highland and Wet Evergreen flora of Southeast Asia and Yunnan province. The northeastern part of India contributes an area of 1,63,799 km 2 forest which is about 25% of the total forest cover of the country (Anonymous 2000). But to no surprise, the forest cover of this region is decreasing day-by-day because of acute deforestation. And to check this fast deteriorating ‘biodiversity pool’ of the region is a real challenge for the government and other concerned organizations in the region because there is lack of scientific management scheme for the same.
Hence, to start with, the need for a regular monitoring of the forests and to build up a digital database comes up. Here, using remote sensing data and application of GIS techniques can provide a fast and reliable monitoring system. Considering all these aspects, an attempt has been made to identify, assess and monitor the plantation using the modern technology of Remote sensing data and GIS techniques. Attempt are made to highlight the present scenario of the plantation programmes taken up by the state government in the region through Joint Forest Management Schemes and also tries to bring out the ground reality of the efforts made by the state government to counter the deforestation.
2. STUDY AREA
Barak basin lies between the latitudes 23 0 10' 00'' N – 24 0 40' 00'' N and longitudes 94 0 00' 00'' E – 95 0 20' 00'' N bordering Nagaland, Manipur and adjoining Assam. The Barak River originates from the northern hills of Manipur (Liyai Khullen village) and flows generally southwestward.
It traverses a distance of 320km in the rugged hilly terrain in the western Manipur. It has number of tributaries viz. Jiri, Makru, Irang, Barak, Leimatak and Tuivai, which flow from north to south and joins the Barak Basin. Barak River with its tributaries is the second largest in the northeastern India and constitutes a part of Ganga-Brahmaputra water resource region. The major portion of the upper catchment is a hilly terrain with medium to degraded vegetation. The river basin is endowed with vast water resources, holding a great potential for the development of the region. Barak watershed is a thinly populated area in the state. The status of the vegetation is decreasing from dense to medium and further to degraded land. The villagers and forest traders, for their needs, are exploiting the timber and non-timber produces in an unscientific manner. The villagers still continue the conventional shifting cultivation practices for their livelihood, as there is no other alternative for the same. The Barak Basin receives the highest rainfall in the state (3126mm/yr). The climate is warm and humid that is suitable for the growth of various vegetation types in the river basin. This region belongs to the sub-humid agro-climatic zone of the country.
3. ROLE OF REMOTE SENSING AND GIS IN FOREST MANAGEMENT
The satellite based multiphase approach of forest inventories with defined objectives provides large amount of data for further processing and computation of volume and yield tables. The standing volume information through inventory data analysis forms as a baseline data to bring out correlation and ground crown density maps. This leads to relate the local specific vegetative cover with respect to its volume and density and therefore, it is possible to estimate the total growing stock of the area by generation of stock maps and conservation through established volume functions. The experience in generation of such stock to volume estimation in Barak Basin has shown promising to explore to avoid cumbersome, field inventories. Similar work has been done by using remote sensing data by Loetsch and Haller (1964), Unni (1990); Weigand Richardson (1990); Roy (1994); Puri et al 1984; Mc Cloy and Hall 1991; Roy et al 1990 and number of other workers have also used the same techniques for forest management and stock assessment. In order to prepare a database and further monitoring of vegetation a Geographical Information System (GIS) is essentially required. These maps along with other natural resources have made a vegetation database of the river basin.
4. EVALUATION OF PLANTATION IN PROTECTED FOREST
State Forest Department has notified most of the Protected Forests in the Barak Basin. The Uningthou Ching Protected Forest, Kangchup-Leimakhong-Irang Protected Forest, Tairenpokpi-Tamenglong Protected Forest and Churchandpur Khoupum Protected Forest fall under 3C2D5, 3C2E3, 3C2E4 and 3C2E5 subwatershed respectively. The major objectives of the study are to monitor the temporal vegetation changes in these subwatersheds and to assess the extent of success made by number of afforestation programme in the same. The most significant factor for the deforestation in these subwatersheds is the National Highway (NH-39) that traverses through two of the subwatersheds (3C2D5 and 3C2E3) whereas a State Highways traverses through the remaining subwatersheds (3C2E4 and 3C2E5). The population is fairly large in three of the subwatersheds (3C2D5, 3C2E3 and 3C2E5) with an average number of 75 villages in each subwatershed. Although the population density in Barak Basin, as a whole, is low due to lack of minimum infrastructure, but these subwatersheds represent a high population density due to the connectivity through national and state highways. Therefore, these subwatersheds are selected for the present study.
5. MATERIAL AND METHODOLOGY
Base map of the study area is prepared using the Survey of India (SOI) toposheets. Remote sensing data of IRS-1C LISS III is used for the digital image processing, identification and monitoring of plantation. The following methodology has been precisely adopted to identify the plantation sites in the Protected Forest of the Barak Basin.
Firstly, the locations of the sample plantation site are recorded using Garmin’s hand held GPS (Figure 1a) and assessment of crown growth density was done during the field visit. The GPS locations of plantation site are then imported in the GIS platform. These locations are then overlayed on the digital satellite scene (Figure 1b) to identify the pixels corresponding to plantation sites that will be used as training sets during the Subpixel Classification (Figure 2). These pixels are then standardise and their spectral signatures (Figure 3) are calculated to obtained maximum accuracy.
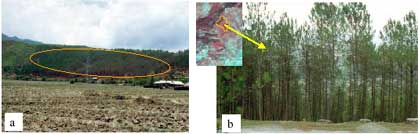
Figure 1: a) Identified Sample Plantation Site; b) Transferring GPS location to the satellite data
5.3 Subpixel Classification
Subpixel classifier module available in ERDAS IMAGINE 8.4 is used to identify the existing plantation sites (corresponding to 15 x 15 mts area on the ground) using the spectral signatures. The following steps are further involved in Subpixel classification.
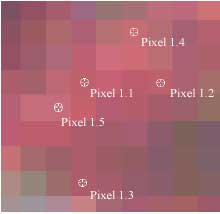
Figure 2 Pixels Used for Identification of plantation
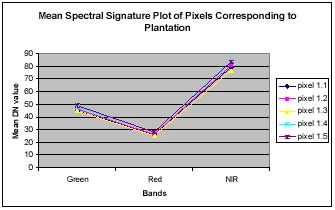
Figure 3 Mean Spectral Plot of the Selected Pixels
5.3.1 Preprocessing:
It is an automated process applied prior to the developing a signature or performing a Material of Interest (MOI) classification that surveys the image for backgrounds that will be removed during Signature Derivation and Classification.
5.3.2 Environmental Correction:
This step compensate for unwanted spectral variation in pixels of the scene. These variations are caused by differences in atmosphere and other environmental conditions. The process automatically calculates environmental correction factors and output them to a file. These correction factors are applied during process of signature derivation and Material of Interest Classification.
5.3.3 Signature derivation:
A manual signature derivation method is used for the present studies. It is used to generate a single signature from a fixed set of input parameters.
5.3.4 Material of Interest Classification (MOI) classification:
This classification process applies signature to an image to locate pixel containing a particular material of interest. There are two types of classification viz. ‘in scenes’ and ‘scene-to scene’, depending on whether the signature was developed from a current scene or from a different scene.
5.4 In-scene Material of Interest (MOI) Classification:
This method is performed in Uningthou Ching PF in the 3C2D5 subwatershed. And further the scene-to-scene classification is applied to the Protected Forests within the remaining subwatersheds (3C2E3, 3C2E4 & 3C2E5) in order to delineate the plantation sites. Since, the species for plantation is same (Pines), therefore, the results derived from the classification are reasonably accurate.
5.5 Transfer of Plantation Site Database into a GIS Database:
The plantation site database thus created in the above steps is then transferred (Figure 4) into a GIS database of the subwatersheds using the Vector module of the ERDAS IMAGINE 8.4. This is a very important step that enables the monitoring and critical analysis of plantation as well as factors responsible for forest degradation in a GIS domain.
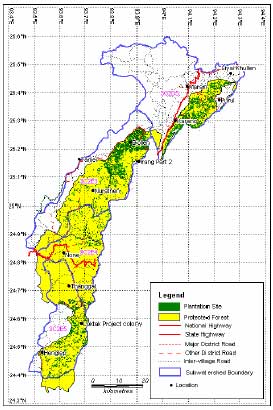
Figure 4 Plantation sites in PF of subwatersheds
6. RESULTS AND DISCUSSION
The monitoring of vegetation in these protected forests indicates the loss of thick vegetation as significantly high (Table 1). The temporal changes in the thick vegetation can be compared with subsequent increase in moderate vegetation, sparse vegetation and degraded land. The increase in moderate vegetation is very less and indicates that the felling of trees from the thick vegetation areas has converted them into sparse vegetation and degraded land. If the felling of trees could be less, the moderate vegetation areas could have been increased. What is the impact of forest clearing for timber and non-timber products is seen in the temporal changes in the vegetation cover (1984-1998).
Considering the reduction in thick vegetation and moderate vegetation due to timber clearing from these protected forests, the attempts made by State Forest Department in Pine plantation, being initiated during 1977, in random manner are successful attempts. But, due to lack of scientific database, the plantation sites are either along he roadside or near the village habitations in the protected forest. According to an official data collected from sawmill located at the Imphal and surrounding areas and based on the national standard (10-12 m 3 of timber can be extracted from 3 hectares of forest land), it is estimated that 95,972 m 3 of timber was extracted during 1984 to 1998 with an average rate of 6,855 m 3 per year.
Since the establishment of the State Forest Department during 1971 the demarcation of ecologically vulnerable areas has been done and number of Reserved Forest and Protected forest has been added in the subwatersheds (Figure 5) to enhance the management programmes. The forest plantation sites are located in these four protected forests. Although the plantation attempts made by state agencies is not as per the rate at which vegetation degradation is, however, these attempts are seem to be a continuous efforts by the government and the villagers. People participation should be encouraged as the village council holds 48% of the forestland and remaining 52% is under the state forest department.
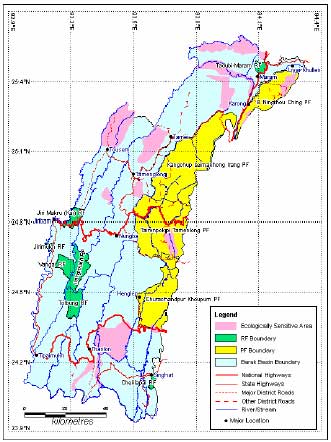
Figure 5 Ecologically Sensitive Areas in the Barak Basin
The monitoring of forest plantation sites has become essential to create awareness among the people to create the forest for younger generation. The present study has been made in four selected subwatersheds that were selected on the basis of the priority delineation made during the priority rating in the Barak River basin and requires expanding through out the state to assess the impact of eco-friendly schemes in the forest area.
7. CONCLUSION
Application of Digital Image Processing techniques has proved successful in identification of forest plantation sites in the Protected Forests area. The total area of plantation in these Protected Forests is approximately 20 km 2 , the age of plantation is approximately 25 yrs and the size of their stem is >1.5ft diameters. Using the digital image classification and critical analysis of the IRS-1C LISS III data has been proved quite useful in locating these plantation sites in the subwatersheds.
REFERENCES
- Anonymous 2000. State of Forest Report 1999. Forest Survey of India, Dehradun. Loetsch, F and Haller, K.E., 1964. Forest Inventory, BLV Verlagsesselschagt, Munich. Mc Cloy, K.R. and Hall K.A, 1991. Mapping the density of woody vegetative cover using Landsat MSS digital data; Int Remote Sensing 12 1877-1885.
- Puri, G.S., Meher-Homji, V.M., Gupta, R.K. and Puri,V., 1984. Forest Ecology. Oxford Publishing House. Calcutta.
- Roy, P.S., 1994. Space Remote Sensing for Forest Eco-System Analysis Paper presented at 3rd ISY-Regional Remote Sensing Seminar on Tropical Eco-system management held during 23- 25th August, 1994 at Bali (Indonesia).
- Unni, N.V., M. 1990. Space and Forest Management. Proceedings of space and forest management, Special Current Even Session 41st, IAF Congress, Dresden, Germany.
- Weigand, C.L and Richardson A.J. (1990) Use of spectral vegetation Indices to inter leaf area, ET and yield : 1 Rationale Agron J. 82: 623-629- Annexure-1.