| GISdevelopment.net ---> AARS ---> ACRS 2004 ---> Data Processing: Image Classification |
Mapping Bamboo Forest
Expansion in the Suburb of Fukuoka City Using Aster Data
Yuko
FUKUI
Researcher, Earth Remote Sensing Data Analysis Center
Forefront Tower 14F, 3-12-1 Kachidoki, Chuo-ku, Tokyo, Japan, 104-0054
phone +81-3-3533-9310, fax +81-3-3533-9383,
Email: fukui@ersdac.or.jp
Tetsushi TACHIKAWA
Researcher, Earth Remote Sensing Data Analysis Center
Forefront Tower 14F, 3-12-1 Kachidoki, Chuo-ku, Tokyo, Japan, 104-0054
phone +81-3-3533-9310, fax +81-3-3533-9383,
Email: tatikawa@ersdac.or.jp
Yasuteru IMAI
Researcher, KOKUSAI KOGYO CO., LTD.
5 Sanbancho, Chiyoda-ku, Tokyo, Japan, 102-0075
phone +81- 3-3288-5812, fax +81-3 -3288-5662,
Email: yasuteru_imai@kkc.co.jp
Masahiro SETOJIMA
Chief Engineer, KOKUSAI KOGYO CO., LTD.
5 Sanbancho, Chiyoda-ku, Tokyo, Japan, 102-0075
phone +81- 3-3288-5812, fax +81-3 -3288-5662,
Email: masahiro_setojima@kkc.co.jp
Researcher, Earth Remote Sensing Data Analysis Center
Forefront Tower 14F, 3-12-1 Kachidoki, Chuo-ku, Tokyo, Japan, 104-0054
phone +81-3-3533-9310, fax +81-3-3533-9383,
Email: fukui@ersdac.or.jp
Tetsushi TACHIKAWA
Researcher, Earth Remote Sensing Data Analysis Center
Forefront Tower 14F, 3-12-1 Kachidoki, Chuo-ku, Tokyo, Japan, 104-0054
phone +81-3-3533-9310, fax +81-3-3533-9383,
Email: tatikawa@ersdac.or.jp
Yasuteru IMAI
Researcher, KOKUSAI KOGYO CO., LTD.
5 Sanbancho, Chiyoda-ku, Tokyo, Japan, 102-0075
phone +81- 3-3288-5812, fax +81-3 -3288-5662,
Email: yasuteru_imai@kkc.co.jp
Masahiro SETOJIMA
Chief Engineer, KOKUSAI KOGYO CO., LTD.
5 Sanbancho, Chiyoda-ku, Tokyo, Japan, 102-0075
phone +81- 3-3288-5812, fax +81-3 -3288-5662,
Email: masahiro_setojima@kkc.co.jp
ABSTRACT
Wild bamboo forests have been expanded into Satoyama coppice forests, mainly in western part of Japan. The uncontrolled expansion of bamboo forests is concerned of its impact to ecology in Satoyama coppice forests and increased a risk of landslide. In order to prevent the uncontrolled expansion, it is not sufficient to investigate a present distribution of bamboo forests. The past distribution and future potential distribution are essential. This paper demonstrated image classifications to extract the present and past distribution of bamboo forests using ASTER and LANDSAT TM data respectively. The results showed that a Decision Tree Classifier, whose thresholds were determined using ASTER band3 (near infrared) and band4 (short wavelength infrared), could estimate the forests at the accuracy of over 70%, provided that the bamboo forest area is over 4,500 square meters. It was possible to estimate the expansion between present and past at the accuracy of over 60%. Ultimately, a prediction map of bamboo forest expansion was successfully generated based on the land conditions desirable for the expansion.
1. INTORODUCTION
Wild bamboo forests have been expanded into Satoyama coppice forests mainly in western part of Japan. Controlled bamboo plantation was originally conducted to cultivate bamboo shoot and wood materials (construction, agriculture and fishery). Many bamboo forests, however, have been abandoned due to decrease in the demand and wildly expanded into Satoyama coppice forests. The uncontrolled expansion of bamboo forests is concerned of its impact to ecology in Satoyama coppice forests and increased a risk of landslide. However, few researches have been done over a wide range area so far. This study was carried out for the purpose of developing a monitoring method to prevent the uncontrolled expansion of bamboo forests.
2. STUDY AREA
The study targeted the area of 20 square kilometers in the suburb of Fukuoka city, northern Kyusyu. Validation area was set in the study area. Departure from farming is accelerating the expansion of wild bamboo forests into abandoned plantation fields and orchards in the periphery of Fukuoka city.
3. DISTRIBUTION OF BAMBOO FORESTS
3.1.Method
ASTER surface reflectance (level 2b05 product) observed on 1st June 2002 was applied to investigate spectral property of bamboo forests, and the distribution of bamboo forests was estimated by image classification.
IKONOS data observed on 2nd April 2001 was used as a reference data for training samples. The categories are four dominant tree spices: bamboo, coniferous tree, evergreen broadleaf tree and deciduous broadleaf tree. Surface reflectances of ASTER VNIR to SWIR in these training samples were measured so as to investigate spectral property of bamboo forests.
Based on this spectral property, Maximum Likelihood Classifier and Decision Tree Classifier were evaluated. The Maximum Likelihood Classifier is the most widely used method of land cover classification. In this study, two kinds of Maximum Likelihood Classifier using 9 bands (all band of ASTER VNIR to SWIR) and 3 bands (band3, 4, 6) were conducted. The Decision Tree Classifier is a hierarchically based classifier, which allocates pixels to categories according to comparing the pixel value with the spectral range of category. Two kinds of Decision Tree Classifier were conducted in this study. One is "Subtractive Method" which classified tree spices using thresholds of different values between band3 and band4. Other is "Additive Method" which determines thresholds individually using band3 and band4.
3.2.Result
As shown in Fig.1, spectral property of bamboo forest was characterized by band3 (near infrared) and band4 (short wavelength infrared). The spectral reflectance of bamboo forest is lower in band3 (near infrared) and higher in band4 (short wavelength infrared) than other tree spices.
Table 1 The accuracy of validation area
Table 1 shows the results of the accuracy evaluation, obtained from four kinds of image classifications of the validation area. An interpretation of IKONOS data was used as a validation data. The Maximum Likelihood Classifier underestimated the areal expansion of bamboo forests. A Decision Tree Classifier; "Subtractive Method" also underestimated bamboo forest area. The other Decision Tree Classifier; "Additive Method" estimated the area of bamboo at a ratio of 117.5%. However, the "Additive Method" was the most effective of the three classification methods, at the extraction ratio of 71.5%, correct answer ratio of 61.4% and detection ratio of 85.4%. It was possible to estimate bamboo forests at the correct answer ratio of 70%, restricted to the forest of over 20 pixels (4,500 square meters). The result is consistent with an early study (Koizumi et al. 2003). Fig. 2 shows distribution map of bamboo forests over study area obtained from "Additive Method".
Fig. 1 Spectral property of bamboo forest
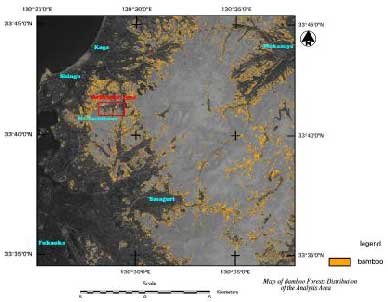
Fig. 2 Map of bamboo forests distribution
4. DYNAMIC PHASE OF BAMBOO FOREST
4.1.Method
LANDSAT TM data observed on 15th May 1987 was used to investigate spectral property of bamboo forest and extract the forest status of the past. The past bamboo forest distribution was applied for the analysis of the dynamic phase of bamboo forests in-between the two periods. Digital numbers of LANDSAT TM in the training samples were measured. The tendency of spectral property of bamboo forest showed similarity to ASTER data. An “Additive Method” was applied to the LANDSAT TM data. The dynamic phase map of bamboo forests was generated based on the difference of bamboo forest distribution in-between the two periods
4.2.Result
As shown in Table 1, the area of the bamboo forest back in 1987 was estimated at 87.5%. Other indices on accuracy were close to those of the image obtained recently by ASTER, i.e. the extraction ratio of 65.6%, correct answer ratio of 75.0% and detection ratio of 83.3%. The interpretation of an aerial photograph observed in September 1987 was used as a validation data. Fig. 3 is the dynamic phase map of bamboo forests. Areas which showed difference, were estimated at an excessive rate of 148.9%. The extraction ratio, correct answer ratio and detection ratio were almost equivalent to those of the present image. The dynamic phase map of bamboo forests over the study area shows expansion of bamboo forests to the periphery of city and along the valley.
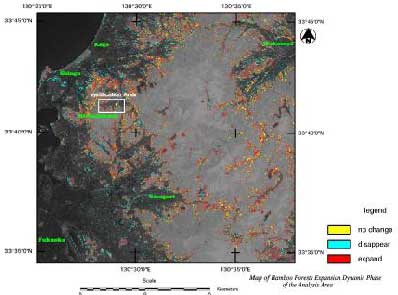
Fig. 3 Map of bamboo forest dynamic phase
5. PREDICTION MAP OF BAMBOO FORET EXPANSION
5.1.Method
Based on the field survey of the land conditions where bamboo forests expanded and sample analysis in the validation area, the criteria for bamboo expansion were established and a prediction map was made experimentally. In the process, it became clear that bamboo is more likely to proliferate in the following land conditions; southern side of a slope, along the slope of less than 30-degree inclination, an area less than 20 meters away from valley, a plantation field and an orchard. Therefore the land condition data sets; distance from the bamboo edge, aspect of slope, inclination, distance from valley and land use, were generated based on the distribution of present bamboo forests using ASTER DEM (level 4A01 product) and ASTER surface reflectance (level 2b05 product). These land condition data were divided into three categories according to relevance of bamboo forest expansion and the criteria for bamboo expansion were established. 2 meters per a year in speed was applied as the distance from the present bamboo edge (Torii, 1998 2002). The prediction map of bamboo forest expansion over study area was successfully generated through applying overlay processing of GIS analysis.
5.2.Result
The map classifies locations with higher and lower possibilities of bamboo forest expansion (Fig. 4). The measure against the bamboo forest expansion requires giving priority consideration in the higher area of expansion possibility. The prediction map of bamboo forest expansion is effective in the point which bamboo forest location and quantity can obtain simultaneously.
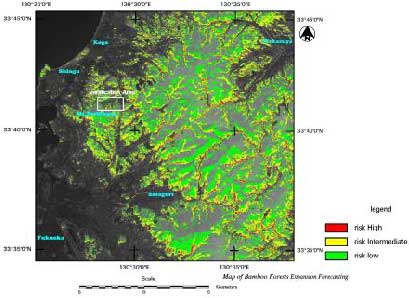
Fig. 4 Map of bamboo forest expansion prediction
6. CONCLUSIONS
We tested Maximum Likelihood Classifier and Decision Tree Classifier for estimating distribution of bamboo forests. The results showed that a Decision Tree Classifier, whose thresholds were determined using ASTER band3 (near infrared) and band4 (short wavelength infrared), could estimate the forests at the accuracy of over 70%, provided that the bamboo forest area is over 4,500 square meters. It was possible to estimate expansion of bamboo forests at the accuracy of over 60% based on the similar method. Prediction map was made experimentally based on the land conditions desirable for the expansion. It suggested that making prediction is potentially an effective measure to control the unduly bamboo expansion.
References
- Koizumi,K., Tanimoto,C. and Piao,C., 2003. Extraction of Bamboo Stands by observing Landsat 5-TM. Journal of the Japan Society of Photogrammetry and Remote Sensing, vol.42 , no.6 ,pp.42-51.
- Torii,A., 1998. Estimation of range expansion rate of bamboo stands using aerial photographs -Case study on Mt.Hachiman, Shiga Prefecture, and Mt.Otoko, Kyoto Prefecture, Japan-. Japanese Journal of Ecology, vol.48, pp.37-47.
- Torii,A., 2002. Estimation of Range Expansion Rate of Bamboo Stands Using Aerial Photographs (II): Case Study on Mt.Amano-kaguyama, Nara Prefecture, Japan. Papers on Environmental Information Science, vol.16, pp.375-380.