| GISdevelopment.net ---> AARS ---> ACRS 2004 ---> New Generation Sensors and Applications: Hyperspectral Sensing |
Measuring Inter-Band Spatial
Separation by Using Cross-Correlation Operation
Miss Li-Hsueh Chang, Mr.
Ming-Fu Chen, and Dr. Nai-Yu Chen
National Space Program Office (NSPO)
National Application Research Laboratories,
8F, 9 Prosperity 1 st Road
Science-Based Industrial Park, Hsin-Chu City, Taiwan, R.O.C.
TEL: 886-3-5784208 FAX: 886-3-5799972
Email: LHChang@nspo.org.tw, Blake@nspo.org.tw, nychen@nspo.org.tw
National Space Program Office (NSPO)
National Application Research Laboratories,
8F, 9 Prosperity 1 st Road
Science-Based Industrial Park, Hsin-Chu City, Taiwan, R.O.C.
TEL: 886-3-5784208 FAX: 886-3-5799972
Email: LHChang@nspo.org.tw, Blake@nspo.org.tw, nychen@nspo.org.tw
ABSTRACT
Push-broom mechanism has been employed successfully in several remote sensing satellite programs, including the ROCSAT-2. To simplify the instrument architecture, CCD arrays configured with along-track pointing deviations are usually utilized in a push-broom device for acquiring image data of different spectral ranges. As a result, inter-band spatial separation presents. The artifact is usually removed with a band-to-band registration operation performed in image pre-processing phase. To ensure a proper band-to-band registration, knowledge regarding CCD pointing deviation is essential. A cross correlation-based algorithm is proposed in this work for finding CCD pointing deviation. Patches are first selected from the image. Follows, cross-correlation, image resampling, and correlation interpolation are applied to detect inter-band spatial separations. From which, the CCD pointing deviations are deduced accordingly. To examine the proposed algorithm, a validation scheme is also developed in this work. By using a number of simulated data sets, we validated that the proposed algorithm is capable of detecting reliably the inter-band spatial separation with an accuracy around 0.1 ~ 0.2 pixel. It is noticed however to achieve such level of accuracy, factors such as terrain variations, surface canopy should be counted in. Applying the purposed algorithm on ROCSAT-2 data, the preliminary results show that the inter-band spatial separation is close to the pre-launch measurement. Yet, systematic residual presents. A refinement on CCD pointing model has been performed accordingly, which leads the inter-band spatial separation of ROCSAT-2 products to an order within 0.2 pixels. 1.0 INTRODUCTION Launched in May 2004, the Remote Sensing Instrument (RSI) on board the ROCSAT-2 satellite acquires Panchromatic (PAN) and 4 bands of Multi-Spectral (MS) images. Due to focal plane CCD array configuration, inter-band spatial separation is expected for those image lines. Though the pre-launch measurement has provided the CCD pointing information, there is still a need of examining on orbit the inter-band spatial separation, and also to refine the geometry parameters of RSI.
A cross correlation-based algorithm is therefore developed for measuring the inter-band spatial separation. By taking into account the influence of satellite motion, attitude change, Earth rotation and so on, the CCD pointing is further refined according to measurement results.
2.0 ALGORITHM AND SCHEME
2.1 Cross Correlation Function
The similarity between two 2-D discrete functions,(,) fx y and (,) g x y, could be evaluated by using a 2-D correlation operation defined as the following:

where, r is known as the normalized correlation coefficient, f and g denote respectively the average values of functions f and g. Extended from this definition, cross-correlation operation is usually applied for finding the related displacement of two similar 2-D functions. Let i and j denote 2-D displacement, the normalized 2-D discrete cross-correlation function r(i, j) is defined using the following equation:

where, the averages f and g are displacement dependent functions and should be calculated using the following equations:

By locating the maximum correlation coefficient, the related displacement between 2 similar functions could be found. Equations above could be used to detect the related displacement of 2 discrete images of the same pixel spacing. For images of different pixel sizes, perform resampling before the foregoing cross-correlation operation. Note that the precision of displacement found in this way is restricted to pixel. To estimate sub-pixel displacement, correlation interpolation is used.
2.2 Displacement Detection Scheme
A patch-by-patch cross-correlation based scheme is developed in this work. The following paragraph describes the implementation of the proposed algorithm.
- Overall displacement removal: To speed up the automatic measurement process, the overall related displacement is first removed based on a prior knowledge. For that the ROCSAT-2 employs spacecraft agility to perform imaging tasks, the displacement is estimated according to the pre-launch CCD pointing information as well as the vehicle motion and attitude data.
- Image resampling: The nominal pixel sizes of ROCSAT-2 RSI images are 2 m and 8 m for panchromatic (PAN) and multi-spectral (MS) data respectively. To detect the related displacement between PAN and MS images, a standard cubic convolution method is applied to resize the images of interest to the same scale.
- Patch selection: Equal-spaced kernel and search patches are implemented in our cross-correlation operation. Ideally, the size of a kernel patch should be determined according to the characteristic length of ground targets. For simplicity however, a single fixed size is used for all kernel patches. To find an adequate size, an iterative try-and-error procedure is implemented. Small kernel size is tried first. The following iteration increases the size gradually until a stable solution is found. The size of search patch is set in our procedures as the kernel size plus twice of the expected maximum related displacement.
- Cross-correlation operation: By applying equation (2), the discrete cross-correlation function of each patch pair is found. The function maximums are then used to locate the related displacement to a pixel precision.
- Polynomial interpolation: Surrounding each grid of maximum correlation, the continuous cross-correlation function is approximated by using a 2-D low-order polynomial. Locating the maximum of the modeled function, a subpixel precision related displacement is estimated. In this work, 2 nd order polynomials are introduced and the maximum is located with a precision of 0.1 pixels.
Due to the nature of ground coverage, misdetection is inevitable in cross-correlation operation.
To prohibit from reaching incorrect outcomes, unreliable data points are removed by statistics means. The outlier removal procedure is portrayed as the following:
- According to correlation coefficients, the highest and lowest 5% data points are discarded.
- The principle direction of displacement is determined based on the scatter diagram plotted from the remaining data. A data point is invalidated providing its direction deviated from this principle direction 45 or more.
- For each survival patch pair, the length of related displacement is calculated. The mean and standard deviation are found accordingly. Data points lie outside of twice the standard deviation are considered outliers and are discarded.
While cross-correlation operation is clearly defined in eq. (2), the impacts of image resampling and correlation interpolation operations on displacement detection have to be carefully evaluated.
Thanks to its similar spectral characteristics, a QuickBird image taken over HsinChu area was used as the test image to generate simulated ROCSAT-2 RSI image patches.
3.1 Impacts of correlation interpolation:
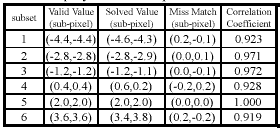
To evaluate the impacts of correlation interpolation, simulated patches are created from the test image. Two sub-images of size m x m with given offset (l, k) are segmented from the test image, where l << m, k << m. By applying image average operation, both sub-images are reduced 10 times. In other words, a pair of patches with size 0.1m * 0.1m, related displacement (0.1l, 0.1k) is ready for displacement detection. Following the foregoing procedures, a number of experiments have been performed, and the results are tabulated in Table 1. It shows the proposed displacement detection algorithm is capable of detecting sub-pixel displacement with an accuracy of around 0.1 pixels.
3.2 Impacts of image resampling operation:
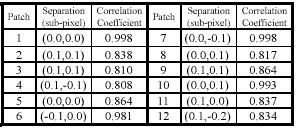
A similar approach is adopted for evaluating the impacts of image resampling operation. A panchromatic image patch is segmented from the test image. To emulate an MS patch, the patch is reduced 4 times by image average operation. A subsequent cubic convolution resampling is then applied to magnify this MS patch 4 times. In the other words, a PAN image patch and a resampled MS image patch with offset (0,0) are ready for displacement detection. The examination has been repeated several times, and Table 2 shows some of this results. It illustrates clearly by neglecting the difference of spectral responses, the proposed algorithm could be used to detect the related displacement between panchromatic and multi-spectral images with an accuracy of about 0.1 pixels.


3.3 Impacts of ground coverage:
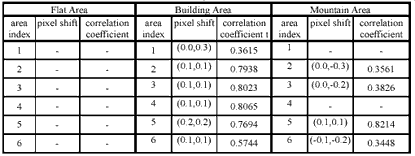
In addition to previous single band examinations, we performed also some cross band experiments. From our experiments, we observed that the ground coverage plays a key role in the proposed algorithm. Three types of surface features are discussed in this section, the flat area, the build-up area, and the mountain area. Table 3 and Table 4 demonstrate our observations.
Obviously, band 1 and band 2 are quite similar regardless of terrain type. With few exceptions, the related displacement we found between these two bands has reached the limitation of our displacement detection scheme. Similar results are also found in bands 1, 3 and bands 2, 3 cases.
As for band 4, we found it is comparatively less correlated to the other bands. The occurrence of outliers is thus relatively higher as a result. Taking into account the spectral response of various ground coverage, we conclude that the results are as expected and an outlier removal process is needed especially when dealing with the band 4 data.


4.0 CASE STUDY
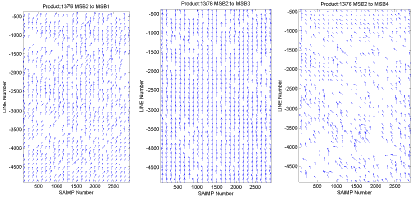
Some early-stage ROCSAT-2 level 1A multi-spectral test products are used in this work for case study. The left panel of Table 5 briefs the displacements measured from near-nadir-viewing images. It shows the band-to-band displacements of these early-stage products might reach one pixel or so. Larger displacements are also found on those images acquired with essential viewing angles. To analyze the nature of this phenomenon, displacements found from each patch are plotted. Figure 1 illustrates an example of such a plot. It demonstrates clearly the displacements we observed exhibit certain sort of systematic bias. Further analysis suggests the deviation of CCD pointing information is the main reason for causing such a systematic bias.
Base on our measurement and observation, a subsequent refinement on ROCSAT-2 RSI geometry model has been performed. The right panel of Table 5 tabulates the displacements measured from re-generated images. It shows with the latest set of CCD pointing parameters, the inter-band spatial separation of current ROCSAT-2 products is less than 0.5 pixels. For that image resampling operation is not involved in current ROCSAT-2 level 1A product generation process, the results we obtained are considered a meaningful improvement.


Figure 1. Plot the displacements of each patches of one study case
5.0 CONCLUSIONS
In this work, we proposed a cross-correlation based algorithm for detecting the inter-band spatial separation. Based on our experiments using simulated datasets, we validate the proposed algorithm is capable of detecting related displacement with an accuracy around 0.1 ~ 0.2 pixels, which is close to the precision limitation of the displacement detection scheme we developed.
Applying this algorithm on some early-stage ROCSAT-2 test products, we found the band-to-band displacement is around one pixel or more. This is mainly due to the systematic bias of CCD pointing information. The systematic bias is roughly deduced in this work and the ROCSAT-2 RSI geometric parameters are refined accordingly. With the latest set of CCD pointing parameters, the inter-band spatial separation of current ROCSAT-2 products is significantly reduced.
6.0 REFERENCES
- Gonzalez, R.C., and R.E. Woods, Digital Image Processing, Upper Saddle River, N.J. :Prentice Hall, 2002.
- Lillesand, T.M., and R.W. Kiefer, Remote Sensing and Image Interpretation, 4 th Ed., John Wiley & Sons, Inc., 2000.
- Paul Bourke, Cross Correlation: 2D Pattern Identification, 1996.
- Young, I.T., J.J. Gerbrands, and L.J. van Vliet, Fundamentals of Image Processing, Delft University of Technology, 1998.