| GISdevelopment.net ---> AARS ---> ACRS 2004 ---> New Generation Sensors and Applications: Hyperspectral Sensing |
Spectral discrimination and
classification of sugarcane varieties using EO-1 Hyperion Hyperspectral
Imagery
Armando Apan
Senior Lecturer and Coordinator, Geospatial Information and Remote Sensing Group,
Faculty of Engineering and Surveying, University of Southern Queensland,
Toowoomba 4350 QLD Australia, Phone: +61 7 4631-1386, Fax: +61 7 4631-2526,
Email: apana@usq.edu.au
Alex Held
Head, CSIRO Office of Space Science and Applications, CSIRO Earth Observation Centre,
GPO Box 3023, Canberra ACT 2601, Australia, Phone: +61 2 6246-5718,
Fax: +61 2 6246-5988,
Email: Alex.Held@csiro.au
Stuart Phinn
Associate Professor and Leader, Biophysical Remote Sensing Group, School of Geography,
Planning & Architecture, University of Queensland, Brisbane 4072 Australia,
Phone: +61 7 3365-6526, Fax: +61 7 3365-6899,
Email: s.phinn@uq.edu.au
John Markley
GIS Analyst, Mackay Sugar, Post Office Pleystowe, Pleystowe 4741 QLD Australia
ABSTRACT
The genetic variety of sugarcane is a major factor in many aspects of sugarcane production. It can control growth rates, yield, sugar content, and resistance or susceptibility to pest and diseases. Thus, reliable auditing of the varieties grown in different areas is necessary for profitable sugarcane cropping. The specific objectives of this study were: a) to assess the spectral separability of different sugarcane varieties, b) to determine which plant attributes will provide the potential discriminating features, and c) to assess the accuracy of image classification to map sugarcane varieties.
Using an atmospherically corrected EO-1 Hyperion image acquired over Mackay, Queensland, Australia, the apparent reflectance signatures from sample areas of sugarcane varieties were analysed using discriminant analysis (DA) to explore spectral separability and to determine the optimum bands and indices. Five and eight cane varieties were separately used for each DA run. Then, image classification was implemented for eight cane varieties using four selected classification algorithms. These were independently performed for: a) 152 individual Hyperion bands, and b) a selection of 20 spectral vegetation indices.
From the discriminant analysis, the classification results indicate a high discrimination between cane varieties, i.e. 97% accuracy for five varieties and 74% for eight varieties. The best indices for discrimination were OSAVI, TCARI, Ratio 770/550, Pigment Specific Simple Ratio (Chlorophyll b) and Simple Ratio 800/550, indicating that pigments and the leaf internal structure were relevant in the discrimination. However, for the classification of the entire image, the results were not encouraging; the highest classification accuracy was only 46%. The low accuracy can be attributed to the high number of classes used (i.e. eight cane varieties) and the many confounding factors pertaining to crops, management regime, growth stage, and background features such as soils. Thus, future approaches should consider the integration of non-image information (e.g. soil information, crop calendar, etc.) and/or exploring the usefulness of other measurable plant attributes (e.g. leaf/canopy geometry).
1. INTRODUCTION
The genetic variety of sugarcane is a major factor in many aspects of sugarcane production. It is related to growth, yield, sugar quality, and resistance or susceptibility to pest and diseases (Bull, 2000; Cox, et al., 2000; Croft, et al., 2000; Bonnett, 1998). Variety is so central in sugarcane cropping that the Sugarcane Industry Act 1999 of Australia requires growers to only plant and grow those varieties covered in the “BSES Approved Variety List”. Thus, reliable information about cane varieties is necessary in sugarcane cropping, particularly when conducting sugarcane growth and yield prediction, or pest and disease vulnerability assessment.
While the use of remote sensing for mapping sugarcane crops has already been attempted (e.g. Soria, et al., 2002; Hadsarang and Sukmuang, 2000; Lee-Lovick and Kirchner, 1991), its specific application to sugarcane variety mapping has been rarely exploited. In addition, the advent of hyperspectral sensors that can potentially discriminate subtle differences in plant bio-physical and bio-chemical attributes has provided new opportunities (e.g. Kumar, et al., 2001).
Therefore, the aim of the study was to examine the potential of a spaceborne hyperspectral sensor (EO-1 Hyperion) to discriminate and map sugarcane varieties. The specific objectives were:
- to assess the spectral separability of different sugarcane varieties;
- to determine which plant attributes (e.g. leaf pigments, leaf internal structure, water absorption, etc.) will provide the potential discriminating features for sugarcane variety mapping; and
- to assess the accuracy of image classification to map sugarcane varieties.
2. RESEARCH METHODS
2.1. Study Area
The study area is located near Mackay (149° 4¢ E and 21° 15¢ S), Queensland, Australia (figure 1). The region is the largest sugar-producing area in Australia. It is dominated by subtropical weather patterns: heavy rainfall in summer and typically dry weather during winter.
There were 20 sugarcane varieties in the study area during the time of image capture. However, 11 varieties constitute about 99% of the total study area. For the statistical analyses and image classification, only eight (8) varieties (about 93% of the total study area) were used.
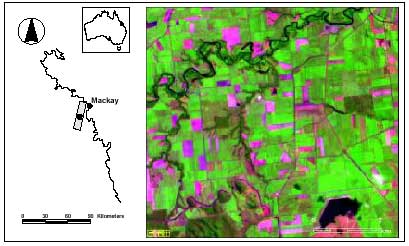
Figure 1. Colour composite of Hyperion image subset (1660nm, 800nm, and 680nm in RGB) captured over a section of the Mackay sugarcane region on 2 April 2002.
2.2. Hyperion Data and Pre-Preprocessing
A Hyperion image was acquired over the study area on 2 April 2002. It covers 242 bands spanning the wavelength range from 356 nm to 2577 nm, with nominal bandwidths of 10 nm. Hyperion has two spectrometers: one for the visible and near-infrared (VNIR: 356 nm to 1058nm) region, the other for short-wave infrared (SWIR: 852nm to 2577nm). This satellite borne sensor covers a swath width of 7.6 km with a 30-m ground pixel size.
The preprocessing techniques applied to the Hyperion image were reported in Apan, et al. (2004). These included the following tasks: a) re-calibration, b) band selection, c) de-streaking, d) repair of “bad” (non-responsive) pixel values, e) conversion to apparent surface reflectance using ACORN 4.10 atmospheric correction software (Analytical Imaging and Geophysics LLC, 2002), f) use of minimum noise fraction (MNF) transformation smoothing, and g) application of the Empirical Flat Field Optimal Reflectance Transformation (EFFORT) polishing technique (Boardman 1998). The original 242 bands were reduced to 152 bands, by excluding the zero data bands, VNIR/SWIR overlap, and the strong water vapour absorption bands.
2.3. Spectral Vegetation Indices and Discriminant Analysis
In addition to the 152 individual Hyperion bands, we used forty (40) spectral vegetation indices (SVIs) generated from our former study (see Apan, et al., 2004). These included Simple Ratio 750/705, Normalised Difference 800/680, Modified Chlorophyll Absorption in Reflectance Index (MCARI), Transformed Chlorophyll Absorption in Reflectance Index (TCARI), Optimised Soil-Adjusted Vegetation Index (OSAVI), to name a few. (Refer to Apan, et al., 2004, for the complete list, the formula used, and the respective references).
Polygons corresponding to eight sugarcane varieties were digitised around sugarcane blocks. A discriminant function analysis was used to generate discriminant functions based on linear combinations of Hyperion indices that provided optimum discrimination between sugarcane varieties (SPSS 2001). This will indicate the magnitude of separability and the corresponding optimum indices. The evaluation of the model’s accuracy was performed by classifying a “hold-out sample” corresponding to 30% of the total sample pixels.
2.4 Image Classification, Post-classification Smoothing and Accuracy Assessment
Using the ENVI 3.5 software, image classification was separately performed for the a) 152 “raw” bands and the b) 20 optimum SVI images. Focusing only on the eight sugarcane varieties, four classification algorithms were employed: minimum distance, Mahalanobis distance, maximum likelihood, and spectral angle mapper.
For the classification accuracy assessment, we used the Mackay Sugar GIS layer of paddock/farm information as the ground truth data. Using simple random sampling, 11,388 pixels were generated and used in the error/confusion matrix accuracy assessment procedure. The overall accuracy and the kappa index of agreement were calculated by the ENVI software. To test the effect on accuracy, several post-classification smoothing transformations were applied to the image classified by the maximum likelihood classifier on the 20 SVI images.
3. RESULTS AND DISCUSSION
3.1 Discriminant Analysis
Figure 2 suggests that separation of two or three selected sugarcane varieties is possible. For instance, in the 550nm band, Q124 and Q136 have good separability. The same relationship can be observed in the 680nm band. Furthermore, higher separability can be observed between Q124 and Q185 in the near infrared region (e.g. 800nm band). In the shortwave infrared (SWIR) region, Q124 and Q190 have high separability in the 1660nm and 2220nm bands. However, when considering all the eight classes, the graph indicates that other varieties have poor spectral separability. For example, in the visible (550nm and 680nm) and NIR (800nm) regions, Q138 and Q190 have very close mean values.
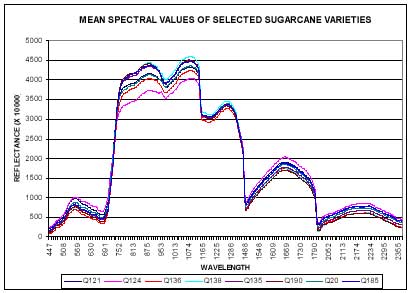
Figure 2. Mean spectral values of individual Hyperion imagery for the selected eight sugarcane varieties. Standard deviation plots not displayed.
The results of the discriminant function analysis on the Hyperion sample pixels of 40 SVIs indicate that the sugarcane varieties can be well discriminated. The classification accuracies for the sample pixels were relatively high: 97.4% for 5 varieties and 72.4% for 8 varieties. Based on 25 th function coefficients, the optimum indices for discrimination are the following: Optimised Soil-Adjusted Vegetation Index (OSAVI), Transformed Chlorophyll Absorption in Reflectance Index (TCARI), Normalised Difference 750/705, Pigment Specific SR (Chlorophyll b) and Simple Ratio 800/550. These indices were all generated from bands located in the visible and near infrared region (rather than the SWIR region), indicating that pigments and the leaf internal structure were relevant in the discrimination.
3.2. Image Classification
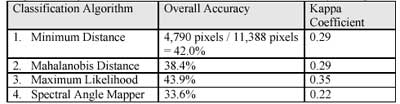
For image classification of sugarcane varieties for the whole image, the results are not promising: the maximum accuracy was only 43.9%, obtained by the maximum likelihood classifier (table 1). This figure was improved slightly using the post-classification majority filter, attaining the highest accuracy of 46%. On the other hand, the accuracy for the 152 individual bands was lower at 42.5% (the maximum value).
Aside from the relatively high number of classes used (i.e. 8 varieties), the low accuracy could be attributed to many factors that can not be easily isolated or controlled. For instance, even if two or three sample varieties are spectrally distinct based on discriminant analysis, the differences in crop growth stage, management regime, and crop health (e.g. due to nutrition, water stress, pests and diseases, etc.) of the sugarcane fields in the study area, may have “degrading” or confounding effect on their separability.
Some limitations of the “traditional” classification algorithms to classify hyperspectral imagery may be a possible reason for the low classification accuracy. For instance, initial results of a study using the same Hyperion dataset for sugarcane variety discrimination show that Random Forest (bagged CART type procedure which grows many trees) and Support Vector Machine (machine learning algorithm) can produce high classification accuracies (Lowe, personal communication).
4. CONCLUSIONS
With the samples analysed using discriminant function analysis, the results show that sugarcane varieties can be discriminated using hyperspectral imagery. The best indices for discrimination were those related to leaf pigments and leaf internal structure. However, for the classification of the entire Hyperion image, the accuracy was low. This low accuracy can be attributed to the relatively high number of classes used, and the many confounding factors pertaining to crops, management regime, growth stage, and background features such as soils. In addition to leaf pigments and leaf internal structure as the basis of discrimination, it may be possible to focus on other non-image information (e.g. soil information, crop calendar, etc.) and some other attributes of the crop (e.g. leaf/canopy geometry) to improve the classification accuracy.
ACKNOWLEDGMENTS
We thank Guy Byrne and Alan Marks (CSIRO) for their help during the field work. Bisun Datt (CSIRO) provided valuable advice during the pre-processing of Hyperion imagery.
REFERENCES
- Analytical Imaging And Geophysics LLC, 2002, ACORN Version 4.10 (Boulder: AIG).
- Analytical Spectral Devices, Inc., 2002, http://www.asdi.com, accessed 09/08/2002.
- Apan, A., Held, A., Phinn, S, and Markley, J., 2004. Detecting Sugarcane ‘Orange Rust’ Disease Using EO-1 Hyperion Hyperspectral Imagery, International Journal of Remote Sensing, 25 (2), 489-498.
- Boardman, J.W., 1998, Post-ATREM Polishing of AVIRIS apparent reflectance data using EFFORT: a lesson in accuracy versus precision. Summaries of the Seventh JPL Airborne Earth Science Workshop, 12-16 January 1998 (Pasadena: JPL), p.53.
- Bonnett, G.D., 1998. Rate of leaf appearance in sugarcane, including a comparison of a range of varieties, Australian Journal of Plant Physiology, 25, 829-834.
- Bull, T., 2000. The Sugarcane Plant. In Manual of Canegrowing, edited by M. Hogarth and P. Allsopp (Brisbane: Bureau of Sugar Experiment Stations), pp. 71-88.
- Cox, M., Hogarth, M., and Smith, G., 2000. Cane Breeding and Improvement. In Manual of Canegrowing, edited by M. Hogarth and P. Allsopp (Brisbane: Bureau of Sugar Experiment Stations), pp. 91-108.
- Croft, B., Magarey, R. And Whittle, P., 2000. Disease Management. In Manual of Canegrowing, edited by M. Hogarth and P. Allsopp (Brisbane: Bureau of Sugar Experiment Stations), pp. 263-289.
- Hadsarang, W. and Sukmuang, S., 2000. Utilisation of Landsat-5 TM imagery for sugarcane area survey and mapping in Thailand, Proceedings of the 21 st Asian Conference on Remote Sensing, December 4-8, 2000, Taipei, Taiwan.
- Kumar, L., Schmidt, K.S., Dury, S., and Skidmore, A., 2001, Imaging Spectrometry and Vegetation Science. In Imaging Spectrometry, Basic Principles and Prospective Applications, edited by F.D. van der Meer and S.M. de Jong (Dordrecht: Kluwer Academic Publishers), pp. 111-155.
- Lee-Lovick, G. and Kirchner, L., 1991. Limitation of Landsat TM data in monitoring growth and predicting yields in sugarcane. Proceedings of Australian Society of Sugarcane Technologists, pp.124-130.
- Lowe, K., 2004. Personal communication, 24 September 2004.
- Soria, F.J., del V. Fandos, C., and Scandaliaris, J., 2002. Using Landsat Data to Estimate Planted Area and Production Levels of Sugarcane in Argentina, The Earth Observer, 14 (3), 12-16.
- SPSS, 2001. SPSS for Windows (Release 11) (Chicago: SPSS).