| GISdevelopment.net ---> AARS ---> ACRS 2004 ---> Data Processing: High Resolution Data Processing |
IKONOS, High resolution
Imagery Evaluation
Jedsada
Kerdsrilek
Geo-Informatics and Space Technology Development Agency (GISTDA),
Bangkok, Thailand
Tel: (66)-2-326-4284 Fax: (66)-2-3264291
Email: jedsada@gistda.or.th
Geo-Informatics and Space Technology Development Agency (GISTDA),
Bangkok, Thailand
Tel: (66)-2-326-4284 Fax: (66)-2-3264291
Email: jedsada@gistda.or.th
Abstract:
This paper reports the evaluation results of several IKONOS product ,using a study area in Chiang Mai Province. Sixty check points were utilized in the study area and network differential GPS technique was applied. The root mean square error and circular error 90 were performed for the check points that passed the regulations.
1. Introduction
Satellite data especially high resolution imagery such as the imagery from IKONOS is considered to have significant value these days. This is due to its high qualities, as the imagery can be timely acquired and the satellite’s imaging system has multi-spectral band, This high resolution imagery is applied in many aspects such as surveying , urban planning and most extensively in mapping. However before such applications are used we need to know if the selected imagery has enough accuracy and suits our requirement as each work requires imagery at different level of accuracy.
Therefore the important process before analyzing or using the imagery is to evaluate its accuracy. In the processing of the high-resolution IKONOS imagery, Space Imaging Southeast Asia evaluates the accuracy of the following product:
Geo Product , Standard Ortho, Reference Ortho, Precision Ortho and Precision + Ortho. This research intended to study the positioning accuracy of each IKONOS imagery product, to ensure that the product was used for the right objective. This project has received co-operation from mapping government organizations and universities such as RTSD , DPT , DOL , Chula , POSU and KMUTT
The Accuracy Evaluation Process is explained on Flow Chart # 1, showing how study area images and high precision check points were obtained. After that we made a measurement of error distance on using the check points. We calculated root mean square error and circular error 90 and the results were kept to apply and use in appropriate aspects .
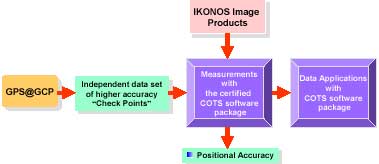
Flow chart # 1 IKONOS imagery evaluation process using checkpoints
2. Field Survey to obtain “Check Point” Independent Data Set
The checkpoints were surveyed using fast-static GPS and used the network satellite measurement technique which gives high precision coordinates. GPS techniques are very significant in this research because if the accuracy of the check points cannot be confirmed, there will be an effect on the evaluation process. This survey network used 5 permanent survey stations of RTSD (Royal Thai Survey Dept.) and we obtained 80 checkpoints, of which positional error was not over 2 centimeters.
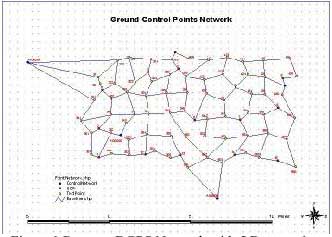
Figure 1 Presents DGPS Network with 5 Base station
3. IKONOS Image Evaluation Process
Test image within Chiang Mai area covers the hilly area such as mountains, downtown and agriculture areas, and is about 20x10 square kilometers in size. There were no more than 1.5 kms overlap, and every 2.25 square kms in the image had one checkpoint, This research used PCI Geometrica V9.0, which is one of the programs that Space Imagine has accepted as sufficient for the accurate reading IKONOS Image format. Next, by comparison between the checkpoints from field measurement, RMSE and CE 90 can be calculated.(Figure. 2) shows the error distance between the coordinates on the image and the true coordinate. On Fig. 3 DGPS surveying on the hilly areaof Chiang Mai is shown.
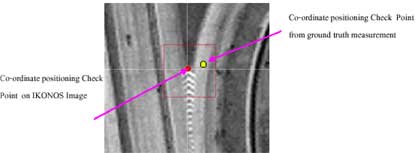
Figure 2 Presents distance error of Check points
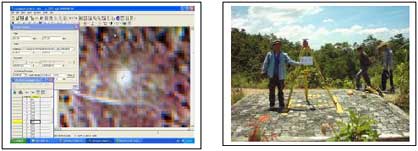
Figure 3 DGPS surveying in hilly area
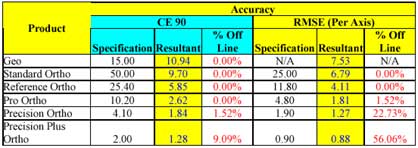
4. Evaluation Result
Our results are show in the table # 1 presenting RMSE and CE90 as the statistics which describes the spatial distribution and confidence of errors respectively.
From Table# 1, we can see RMSE and CE90 calculated from spatial distribution errors compared with the specification of Space Imaging and results that pass the regulations. However, more evaluation process should be performed in a variety of areas and images to assure that the results can cover many areas.