| GISdevelopment.net ---> AARS ---> ACRS 2004 ---> Data Processing: High Resolution Data Processing |
Characterising Elements of
Urban Morphology From High Resolution Optical Remote Sensing Images
B. K. Mohan # and J.Hogg
*
# Centre of Studies in Resources Engineering
Indian Institute of Technology, Bombay
Powai, Mumbai 400076, India
* School of Geography
University of Leeds, Leeds LS2 9JT, UK
# Centre of Studies in Resources Engineering
Indian Institute of Technology, Bombay
Powai, Mumbai 400076, India
* School of Geography
University of Leeds, Leeds LS2 9JT, UK
ABSTRACT
Research into ways of characterising or inferring elements of urban morphology by image analysis of high spatial resolution images from earth-observing satellites shows promise. Road networks form an important component of urban morphology and have been a focus of research in image analysis of cities. Automatic identification of road networks without user intervention and ancillary data like recent maps, however, has not been very successful so far, due to variations in surface illumination, width, surface material, etc. In other words, the local spectral and geometric characteristics of roads are not sufficiently distinctive to separate them from background structures. This paper endeavors to develop a method for the detection of roads in urban scenes of high resolution satellite imagery based on a multiscale feature tracking version of derivative-of-Gaussian based line detector.
URBAN MORPHOLOGY AND REMOTE SENSING
Research into ways of characterising or inferring elements of urban morphology by image analysis of high spatial resolution images from earth-observing satellites shows promise (Mesev, 1998; Mesev et al. 1995; Barnsley and Barr, 1996). The continual advances in remote sensing and computing technologies mean that image analyses of high (< 5 m) and very high (< 1 m) spatial resolution images now facilitate discrimination of ever finer elements of the urban fabric to give new representations of urban form and spatial structures (Donnay et al. 2001). The focus of current research is on the extent to which one may characterise or infer elements of urban morphology by image analysis and on the value of the resulting data for populating integrated geographical information systems of cities (Mesev et al. 1995; Longley and Mesev, 2001; Batty 1999). Urban morphology developed as a branch of urban geography concerned with relationships between urban form, urban function and change (Webster, 1998). With developments in mathematics and computation in the 1970s and 1980s, urban morphology grew to emerge today as an inter-disciplinary research field with a focus on urban systems and urban dynamics, descriptions of urban form and of ways of classifying spatial and temporal relations (Forster, 1983; Batty, 1999). Although cities are socio-economic systems with flows of people, goods and services, the built environment is typically an artifact of past and contemporary urban processes (Longley and Mesev, 2001). Measurement of urban form only provides a static picture, based on measuring at one cross section in time, of urban morphology. There are however many urban morphologies apart from those based solely on urban fabric (Martin, 1991). These relate for example to the environment, to population, employment, industry, health and other socio-economic variables and to spatial and temporal relations between these and urban form (Weber and Hirsch, 1991; Wood et al. 1999; Martin, 1991). The goal in studying different morphologies is to develop a deeper, more consistent and more up-to-date understanding of urban processes and thereby inform urban planning. Although information derived from image analysis of remote sensing images is only likely to contribute a small part of the total information that is required, it can potentially be a significant part which gives a synoptic, consistent and instantaneous view at one or more scales. By combining sequences of such views, changes to urban form can be detected. In this way, remote sensing can contribute to research in urban geography and planning. Of course, there are many critical challenges and obstacles that need to be overcome before we succeed in improving the quality of life of people living in cities. The hope is that the combination of remote sensing and integrated geographical information systems for analysis, modelling, research and planning of cities can contribute towards this end.
There is a significant gap between the potential value that satellite remote sensing and image processing technologies can bring and the actual value being realised today. New very high spatial resolution images from optical remote sensing systems on earth observing satellites provide the essential first step in narrowing this gap. This is because scale-space relations are critical in urban remote sensing and the spatial resolution of images is the single most important technical issue in urban remote sensing (Welch 1982). The second step will be to devise improved theories and methods of image analysis to characterise and extract elements of the urban morphology from very high spatial resolution images (Ebner et al. 1999; Heipke et al. 2000). Although image analysis of high spatial resolution images generally allows improved discrimination of urban features, the effects of relief displacement, shadows from tall buildings and other distortions cause significant difficulties in very high spatial resolution images of metropolitan areas with high rise buildings or steep relief.
The aim of this paper is to investigate methods of extracting linear features from dense urban areas in cities using edge and line detection methods. Evaluation of the potential of certain techniques (to be described below) for delineating road networks from Indian Remote Sensing satellite (IRS) and IKONOS panchromatic images is of particular interest.
EXTRACTION OF LINEAR FEATURES IN URBAN AREAS
Edge detection in digital images is an important low-level operation in image processing and computer vision. It is used as a pre-processing operation in many tasks in computer vision, principally in recognising or describing shapes without any a priori information about the nature or shape of a structure. A special case of edge detection is the extraction of linear features from digital images. This involves local edge linking in a neighbourhood. In photogrammetric and remote sensing tasks, linear feature extraction is used to extract roads, railways, rivers, geological and other linear features from satellite images or aerial photographs.
Early studies on the extraction of roads from low resolution aerial or Landsat satellite images were mainly devoted to classifying individual pixels as either “road” or “background” using only the image data in a small neighborhood surrounding the target pixel. Classical image processing techniques were tried, such as edge detectors and morphological operators. Operators dedicated to the extraction of roads were developed, such as the “Duda-Road-Operator” (Duda and Hart, 1973). One of the approaches to linear feature extraction is to regard the image as a two-dimensional function z(x,y) of the spatial variables x and y;
Steger (1998) proposed an approach to line detection that uses an explicit model for lines and a sophisticated line profile model. The algorithm proposed in this paper uses a multi-scale variation of Steger’s algorithm. The model is based on detecting lines and edges from the derivatives of Gaussian-shaped smoothing operators of controlled width. As the width is varied from a large value to a small value, the features detected also vary from coarse to fine detail. The advantage of this approach is that starting with a coarse and noise free set of lines, the detail is added incrementally while noise does not increase significantly.
Multi- Scale Approach to Line Detection
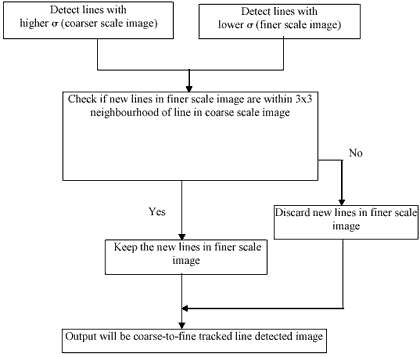
The Gaussian operator is sensitive to noise. Noise is enhanced when a Gaussian line detector with very low value of s is used for line detection. To overcome this problem, the edge focusing method proposed by Bergholm (1987) was adopted along with the Steger’s operator for a new method known as the Multi-Scaling Approach. Figure 1 shows a flow chart for the process.
In this approach, linear features for different sizes of the Gaussian mask (s) with similar lower and upper thresholds are generated. As we go from higher to lower values of s, (i.e. as the size of the window decreases) more line segments are detected, i.e. we get finer and finer line features. The idea is to refine these finer images still more by using the edge-focusing technique. Here we select two images, one at a coarse level and the other at a slightly finer level of detail. We search only around the lines, which are present at both scales. With the coarse-scale image as the base, we search in the 3x3 neighbourhood of the line pixels for the presence of new lines at the finer scale image. Only those new lines that satisfy the above criteria will be kept in the finer image. Others are deleted.

Fig. 1 Flowchart for Multiscaling approach to line detection
RESULTS AND DISCUSSION
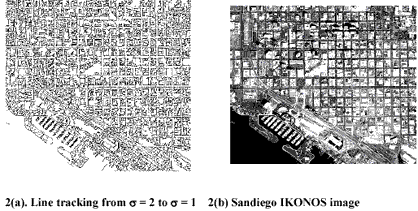
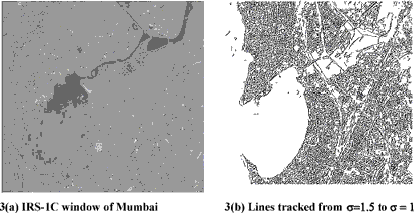
The authors have reported on work done using Ikonos 8-bit and IRC-IC 6-bit panchromatic Images with spatial resolutions of 1 and 5.8 m respectively of urban areas with markedly different levels of morphological complexity. They have been able to characterise to differing levels of detail elements of the urban fabric in both cases. The authors conclude that their approach show promise for characterising Urban morphology by satellite remote sensing, particulary given the improved radiometric and spatial resolution of the latest generation of satelite remote sensing systems such as QuickBird panchromatic images with 11-bit depth and 0.62 m spatial resolution.The IRS-1C image covered part of the urban region of Mumbai, India, shown in figure 2 with the street pattern enhanced image using a modified version of Steger’s algorithm. Figure 3 shows a part of Mumbai city and the line enhanced version. The rationale for the choice of the images that were used in this study is that they contain street patterns of varying complexity. The San Diego image contains a well-defined road structure in a grid-iron pattern, which could be inferred readily using the methods of linear feature detection. The spatial resolution of this panchromatic image was about one meter. The Mumbai city image is complex, in that it has roads of varying widths and quality and buildings in very close proximity to one another.
ACKNOWLEDGEMENTS
This research was supported by a grant from the UK-India Science Technology Research Fund (UISTRF), and by a grant from the ISRO-IIT(Bombay) Space Technology Cell. The authors wish to acknowledge the support from former student G.M. Bhat and CSRE colleague Dr. S.S. Gedam. The Ikonos image of San Diego city was taken for this academic research from www.spaceimaging.com. The Mumbai IRS-1C image was supplied by National Remote Sensing Agency, Department of Space, Government of India.
REFERENCES
- Barnsley, M.J. and Barr, S.L. 1996. Inferring urban land use from satellite sensor images using kernel-based spatial reclassification. Photogrammetric Engineering and Remote Sensing, 62, 949- 958.
- Bergholm, R., 1987, “Edge Focussing”, IEEE Transactions on Pattern Analysis and Machine Intelligence, Vol. PAMI-9, pp.726-741.
- Donnay J-P, Barnsley M J and Longley P A (Eds) 2001. Remote Sensing and Urban Analysis. Taylor and Francis, London, 268 pps.
- Duda, R.O., and Hart, P.E., 1973, “Pattern Classification and Scene Analysis”, John Wiley and Sons, New York.
- Ebner, H. Eckstein, W. Heipke, C. and Mayer H (eds) 1999. Proceedings of ISPRS Conference on: Automatic extraction of GIS objects from digital imagery. International Archives of Photogrammetry and Remote Sensing 32(3-2W5). 365 pages
- Forster, B.C. 19883 Some urban measurements from Landsat data. Photogrammetric Engineering and Remote Sensing. 49, 1693-1707.
- Heipke, C. Pakzad, K. and Straub, B.-M. 2000. Image analysis for GIS data acquisition. Photogrammetric Record 16(96):963-985.
- Mesev, T. 1998. Use of census data in urban image classification. Photogrammetric Engineering and Remote Sensing, 64, 431-438.
- Mesev,,T., Longley, P. Batty, M. and Xie,Y. 1995 Morphology from imagery: detecting and measuring the density of urban land use. Environment and Planning A, 27, 759-780.
- Mesev, T.V., Longley, P. A. and Batty, M. 1966 RS/GIS and the morphology of urban setttlements. In: Longley P A and Batty M (Eds) Spatial Analysis: modelling in a GIS Environment. GeoInformation International, Cambridge, UK.
- Shaban M.A. and Dikshit, O. 2001 Improvement of classification in urban areas by the use of textural features: the case study of Lucknow city, Uttar Pradesh. Int. J. of Remote Sensing. Vol 22, No 4, 565-593.
- Steger, C., 1998, “An Unbiased Detector of Curvilinear Structures”, IEEE Transactions on Pattern Analysis and Machine Intelligence, Vol. 20, No. 2, February, pp. 113-125.
- Webster, C.J. Urban morphological fingerprints. Environment and Planning B: Planning and Design, 23,279-297.
- Welch, R. Spatial resolution requirements for urban studies. Int J of Remote Sensing. 3,139-146. Wood J D., Fisher, P.F., Dykes, J.A., Unwin, D.J. and Stynes, K. 1999 The use of the landscape metaphor in understanding population data. Environment and Planning B: Planning and Design, Vol 26, pages 281-295.
- Zelek, J., S., 1990, “Computer-Aided Linear Planimetric Feature Extraction”, IEEE Transactions on Geoscience and Remote Sensing, Vol. 28, No.4, pp. 567-572.

Fig. 2 Example of a grid-iron road pattern with clearly defined road structure

Fig. 3. Example of a medium resolution image (5.8m pixel size) covering a complex road pattern