| GISdevelopment.net ---> AARS ---> ACRS 2004 ---> Data Processing: Hyperspectral Data Processing |
On The Atmospheric Correction
for a Hyperion Scene
Tian-Yuan
Shih
Department of Civil Engineering
National Chiao-Tung University
Hsin-Chu, Taiwan
Fax: 886-3-5716257
E-mail: tyshih@mail.nctu.edu.tw
Department of Civil Engineering
National Chiao-Tung University
Hsin-Chu, Taiwan
Fax: 886-3-5716257
E-mail: tyshih@mail.nctu.edu.tw
ABSTRACT
The atmospheric correction is performed with a scene of Hyperion over the Taiwan area acquired from the USGS. This study compares the radiance and the corrected reflectance spectra. The software FLAASH was used in this experiment. The cloud mask and water content image generated are compared with an optical image. Different MODTRAN resolution settings and the spectral polishing effect are also studied with the spectra.
INTRODUCTION
Hyperion sensor is a hyperspectral imager on-board of EO-1 satellite. There are 220 spectral bands ranging from 400 – 2500 nm. The spatial resolution is 30 meter per pixel and swath width is 7.7 km. Each scene covers either 42 km, or 185 km. The product is distributed by USGS, and the level one product, which is only radiometrically corrected, is available. The EO-1 satellite was launched on November 21, 2001 as part of a one-year technology validation/demonstration mission. After the original EO-1 mission was successfully completed in November 2001, the remote sensing research and scientific communities expressed high interest in continued acquisition of image data from EO-1. Based on this user interest, an agreement was reached between NASA and the USGS to allow continuation of the EO-1 Program as an Extended Mission (Pearlman, et al., 2003; USGS, 2004a).
The EO-1 spacecraft follows Landsat-7 by approximately one minute, the descending equatorial time of 10A.M. It is capable of cross-track pointing to allow potential imaging within one full adjacent WRS path in each direction from the current flight path. The orbit altitude is the same as the Landsat, which is approximately 705 km. The Hyperspectral imaging has wide ranging applications in mining, geology, forestry, agriculture, and environmental management. Detailed classification of land assets through the Hyperion will enable more accurate remote mineral exploration, better predictions of crop yield, and assessments, and better containment mapping (USGS, 2004b).
The apparent reflectance should be derived because the data released from USGS is the level one, radiometrically corrected only, for spectral analysis based applications. This process is named atmospheric correction. There are currently several packages commercially available for this function, such as ACORN (ImSpec, 2004), ATCOR (Leica, 2004), and FLAASH. This study uses FLAASH in ENVI (RSI, 2001). This software is a MODTRAN based package. With several defined atmosphere models and aerosol models, the user interface is simplified. The process of this experiment is documented in this paper and the resulting spectra is also compared with those original ones. Compared with ACORN, FLAASH is less sophisticated and has lesser input requirement. For example, FLAASH does not require the spectral center wavelength and the FWHM (Full Width Half Maximum) value. Therefore, the center wavelength shifting of each bands in Hyperion image, will not be dealt with using FLAASH.
There is no offset setting in FLAASH either, which may be important when the offset value does exist, such as the MASTER image.
THE ATMOSPHERIC CORRECTION
There are three files coming with the distributed scene, the metadata (.met), the image (.L1R), and the header file (.hdr). The image file is stored in BIL order. For the atmospheric correction, the scene center location is required. This information is available from the .met file. The .met file is a short file. For the scene obtained, the .met file contents are listed as in the appendix A. Besides the scene center locations, the four image corners are also provided with coordinates.
The image used in this study is EO1H1170452003240110KZ. “EO1” stands for the satellite EO1 and “H” stands for Hyperion. The numbers, 117 and 045, are the WRS path and row respectively. 2003 is the year of image acquisition while 240 is the Julian day of acquisition. The first “1” following “240” indicates that the Hyperion sensor is on. The second “1” indicates that the ALI sensor is on. The following “0”, indicates that the AC sensor is off. “K” is a code for the pointing mode, and “Z” is the code for the scene length.
For FLAASH, the flight data and time in GMT is also required. In the header file, there is a date statement, description = { Hyperion L1 Data Product [Thu Sep 11 01:04:52 2003]} The date listed on the .met file and image title for day 240 is August 28, rather than September 11. The one in the .met file listed as HYP start time is used. The other parameter required is the flying height and ground height in kilometers. The flying height is 705 KM from the EO-1 satellite description. The ground height is set to zero km For the scene area in TaiDong (Site Latitude, 22.060000; Site Longitude, 120.730000).
There are 220 unique spectral channels collected with a complete spectrum covering from 357 - 2576 nm. The Level 1 Radiometric product has a total of 242 bands but only 198 bands are calibrated. Calibrated channels are 8-57 for the VNIR, and 77-224 for the SWIR. The reason for not calibrating all 242 channels is mainly due to the detectors' low responsivity. The bands that are not calibrated are set to zero in those channels. There are only 196 unique channels (USGS, 2004b), because of an overlap between the VNIR, band 56 (915.23 nm), 57 (925.41 nm) and SWIR, band 77 (912.45 nm), 78 (922.54 nm), focal planes. In the experiment, all those un-calibrated bands and band 77 and 78 are removed before further processing. The digital values of the Level 1product are 16-bit radiances and are stored as a 16-bit signed integer. The SWIR bands have a scaling factor of 80 and the VNIR bands have a scaling factor of 40 applied. The units are W/m2 SRµm (USGS, 2004b).
VNIR L = Digital Number / 40
SWIR L = Digital Number / 80
An ASCII file is prepared for each band, 196 lines corresponding to 196 bands. The first 50 lines are 40 and the next 146 lines are 80. This file is saved as gain_invmicro.txt. From ENVI, the original Hyperion file could be read directly, but for the atmospheric correction, the native file should be used. The saved file of the ENVI native file is in BSQ format. This has to be converted to either BIL or BIP format for the FLAASH program. This task is performed with the function in Basic Tools/Convert Data. There is no need to perform above stated procedures, because the un-calibrated and overlapped bands are removed first. The spectral subset function can be performed with the original .L1R file, and stored in the native ENVI BIL format.
In the FLAASH menu, the scale factor file is specified at the same time when specifying the input radiance file. That is, the gain_invmicro.txt file is specified as the scale factor. The atmospheric model selected is the Tropical, and the aerosol model is Rural. Aerosol retrieval function is turned on and the initial value for the visibility is set to 40 km. The spectral polishing option has been tested for both on and off options. When the spectral polishing is on, the width for the polishing operator is set to be 9. The IFOV value for Hyperion is 0.043. The aerosol scale height and CO2 mixing ratio is using the default value, which is 2.0km and 390 ppm respectively. MODTRAN resolution can be 15, 5, or 1.
The visibility computed is 68.4373 km for taking MODTRAN resolution 15, and the average water content is 4.0794 cm. For MODTRAN resolution 5, the visibility remains the same and the average water content is 3.8722 cm. As shown in Table 1, while the visibility unaffected by the MODTRAN resolution, the average water content is reducing with the increase of the resolution. This is somehow unexpected.
After the atmospheric correction, the reflectance value of several bands is too low. The resulting value is set to zero by the software. These bands are band 92- 102 and 104, and 137- 153 in the 196-band sequence number. In the original Hyperion sequence, these bands are, band 101-111, 113, and 146-162. All these bands are SWIR bands. In total, there are 29 bands that contain no value. Therefore, 167 bands are left for further processing.
A portion of the original image displayed in band combination (30, 20, 10) for RGB is shown in Figure 3(left). The center scene of Figure 1 is the MODTRAN resolution 15, spectral polished. The unpolished is shown in Figure 1, right. From Figure 1 to Figure 8, it can be observed that the atmospheric correction has restored the reflectance value well. The reflectance features, such as the linear slope in the VIR band for soil, and the steep rise from red to IR of vegetation, are very illustrative from these spectra.
Figure 1: The upper portion of the scene, radiance (left), spectral polished reflectance (center), spectral unpolished reflectance (right)
Figure 2: Vegetation, the spectral of the center pixel in the red box of Figure 1, radiance (left), spectral polished reflectance (center), spectral unpolished reflectance (right)
Figure 3: The human settlement portion of the scene, radiance (left), spectral polished reflectance (center), spectral unpolished reflectance (right)
Figure 4: Cloud, the spectral of the center pixel in the red box of Figure 3, radiance (left), spectral polished reflectance (center), spectral unpolished reflectance (right)
Figure 5: The inland pond (left), the sea water (center and right)
Figure 6: Inland Pond (top), Sea Water, the spectral of the center pixel in the red box of Figure 5 (right), radiance (left), spectral polished reflectance (center), spectral unpolished reflectance (right)
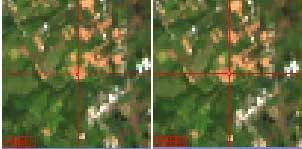
Figure 7: The bare soil
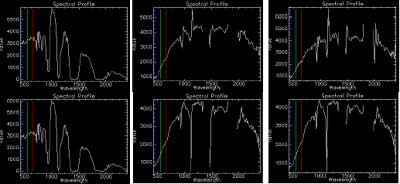
Figure 8: The bare soil, the spectral of the center pixel in the red box of Figure 7 (top for the left), radiance (left), spectral polished reflectance (center), spectral unpolished reflectance (right)
THE CLOUD MASK AND WATER VAPOR
Besides the surface reflectance, the FLAASH also output two other files, the water vapor and the cloud map. The retrieved column water vapor is in units of (atm cm). The river and clouds are effectively seen in the water vapor image. The systematic errors of the Hyperion scene are also a dominant feature on the water vapor image. The range of the water vapor for the complete scene is (-4814, 8905), the mean is 1500.716 and the standard deviation is 4657.605. Over the sea surface, the value is negative. The human settlement area has higher values.
For the cloud map as shown in Figure 9, the black area has a value of zero, which is the cloud free area. The blue area has a value of 1, indicating high altitude clouds, cirrus or tall cumulus. The green area is the opaque clouds, and has a value of 2. The red area is the water retrieval error, it has a value of 4. It is observed that over the sea and water, as well as under the cloud shadow, the cloud mask shows value 4; which is the water retrieval error. The value 5 is in pink, indicates the area of water retrieval error and high clouds.
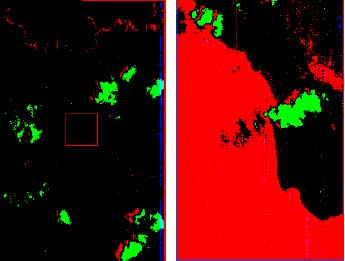
Figure 9: The cloud mask image, the northern forest portion (left), the southern human settlement portion (right)
CONCLUDING REMARKS
Atmospheric correction is an important procedure for spectral analysis based mapping methods. In this study, this procedure has been explored. Although the current atmospheric correction serves only a kind of approximation, and the software used in this study is a less rigorous type, it is found that the spectra after atmospheric correction looks much like the reflectance spectra. Most absorption features can be observed clearly. Due to the low reflectance level in those bands, the original 196 bands are reduced to 167 bands after the atmospheric correction. Regarding the cloud mask generated along with the atmospheric correction procedure, it shows high agreement with the clouds observed from the optical scene.
ACKNOWLEDGEMENT
This work has been developed while the author was visiting the Center for Spatial Technologies and Remote Sensing (CSTARS), Department of Land, Air and Water Resources (LAWR), University of California, Davis, CA 95616, USA. His research has been supported by the National Science Council, Taiwan, under grant NSC42070F.
REFERENCE
- ImSpec, 2004. The ACORN home page, utl: http://www.imspec.com/index.html.
- Leica, 2004. ATCOR for Imagine, Data Sheet, url: http://www.geosystems.de/atcor/index.html.
- Pearlman, J.S., P.S. Barry, C.C. Segal, J. Shepanski, D. Beiso, S.L. Carman, 2003. Hyperion, a Space Borne Imaging Spectrometer, IEEE Transactions on Geosciences and Remote Sensing, 41(6):1160-1173.
- RSI, 2001. FLAASH User’s Guide, Research Systems Inc.
- USGS, 2004a. Earth Observing 1, url: http://eo1.usgs.gov/.
- USGS, 2004b. EO-1 FAQ, url:// http://eo1.usgs.gov/dataproducts/faq.asp#hyperion.