| GISdevelopment.net ---> AARS ---> ACRS 2004 ---> Data Processing: Data Fusion |
SWAP crop model Parameter
Identification using SPOT Vegetation in Suphanburi, Thailand
Panithan Srinuandee,
Kiyoshi Honda, Yann Chemin
School of Advanced Technologies, Asian Institute of Technology
P.O. Box 4 Klong Luang 12120 Pathumthani, Thailand
Tel: +66-2-524-6149 Fax: +66-2-524-5597.,
Amor V.M. Ines
International Research Institute for Climate Prediction
The Earth Institute at Columbia University
Palisades NY 10964 USA. Tel: +1-845-680-4501 Fax: +1-845-680-4864
Email: st100425@ait.ac.th, honda@ait.ac.th, yann.chemin@ait.ac.th
ABSTRACT
In this paper, the methodology to quantify the agriculture practice using remote sensing (RS) is discussed. An approach for low spatial resolution RS data (LSRD) based on data assimilation technique is discussed together with a case study for a large homogeneous agricultural area in Suphanburi, Thailand.
In the data assimilation, the physically based simulation model called SWAP model (Van Dam, 2000) was used to represent the soil-water-atmosphere-plant system. Genetic algorithm (GA) was used to optimize the output of SWAP (e.g. LAI) based on SPOT Vegetation data to determine the date of sowing and the cropping intensity in the study area. The results show that the reasonable parameters (sowing date and cropping intensity) were successfully estimated.
1.Introduction
To study the agricultural in regional scale requires a large amount of data both spatial and temporal data. These data can be taken from High Spatial Resolution Remote Sensing Data (HSRD) or from Low Spatial Resolution Remote Sensing Data (LSRD). In this study LSRD was selected because of its high temporal resolution, but the problem is that agriculture areas are highly possible to be mixed in one pixel, including some data that are non-observable from RS data. Dr. Honda and Ines (2003) have developed a methodology to fix this problem by using the combination of RS-SWAP-GA, data assimilation technique.
This technique is composed of 3 main parts. The first part is used to get data from remote sensing; in this study, LAI (leaf area index) is calculated from NDVI (Normalized Difference Vegetation Index) using SPOT Vegetation images, which were LMF processed. The second part is physically based simulation model called SWAP model, used to simulate the interaction between soil, water, atmosphere and plant. The last part is a genetic algorithm (GA), used to assimilate LAI output of SWAP to LAI from SPOT Vegetation by finding the appropriate date of planting and the cropping intensity. The process of this technique is, GA will evaluate the parameter based on an objective function to minimize the difference of simulated and observed LAI. SWAP model will be invoked repeatedly to evaluate the response of the system and to obtain simulated LAI from the combination(s) of the candidates of parameters until the desired solution is achieved.
This technique was tested with the synthetic data and the results show that this technique can work effectively (Honda, K. and A.V.M. Ines., 2003). The aim of this study is to test the approach with the actual data, but starting from a simple situation that is 2-crops/year in a large continuous area.
3.Data Assimilation Technique
3.1 SWAP model
SWAP (Soil-Water-Atmosphere-Plant) is a physically based, field scale, agro-hydrological model. It has been developed to simulate simultaneously water flow, solute transport, heat flow and crop growth at field scale level (Van Dam, 2000). The model uses Richard’s Equation to simulate vertical soil water movement. The soil hydraulic functions in the model are defined by the Mualem-Van Genuchten (MVG) equations, that describe the capacity of the soil to store, release and transmit water under different environmental and boundary conditions (A.V.M. Ines, 2003). The daily, potential evapotranspiration (ETp) is calculated from Penman-Montieth equation using the meteorological data. Darcy’s law used to determined potential soil evaporation in wet soil condition. Root water extraction at various depths in the root zone is calculated from potential transpiration, root length density and possible reductions due to wet, dry, or saline conditions (J. Eitzinger, 2000). It also integrates the basic WOFOST (WOrld FOod STudies) (Van Diepen et al., 1989), which is a crop growth model and frequently evaluated and used for study the effect of the climate change to the crop production. (see Van Dam, 2000).
3.2 Genetic Algorithm (GA)
GAs is a mathematical model of natural genetics where the processes of nature have been abstracted to be used in search and optimization problems. GA consists of three basic operators: (i) selection, (ii) crossover and (iii) mutation. First, the decision variables are coded into genes (binary or real) and arranged as a string to form a chromosome or an individual. Then, an initial set of strings is randomly generated. This population of strings is a representative set of solutions to the problem. Each string is then evaluated by its performance based on a fitness function. Using this measure, the string competes in a selection process where the fittest survives, selected to enter into the mating pool and the lesser fit dies. Then, the selected strings (now, parents) are randomly assigned a mate; genetic information is exchanged between the two parents by crossover to form their offspring. The parents are then killed and replaced in the new population by the offspring to keep the population size stable. Reproduction between the parents takes place with a probability of crossover. If a generated random number is less than the defined probability of crossover, crossover happens, otherwise not, and the parents will enter into the new population. Moreover, GAs are very aggressive search techniques and they tend to converge quickly to a local optimum if the only genetic operators used are selection and crossover. The reason for this is that GA rapidly eliminates strings with poor measures until all the strings in a population are identical. Without injecting new genetic materials in the population, the solution will not improve any longer. To maintain diversity in the search, the genes are subjected to mutation to keep the population from premature convergence. The process of selection, crossover and mutation are repeated for many generations to produce the best individual(s) that can represent the optimal or near optimal solution to the problem (Goldberg, 1989).
3.3 The combination of RS-SWAP-GA (Data Assimilation Technique)
GA will evaluate the parameter based on an objective function to minimize the difference of simulated and observed LAI. SWAP model will be invoked repeatedly to evaluate the response of the system and to obtain simulated LAI from the combination(s) of the candidates of parameters until the desired solution is achieved.
4.Case Study
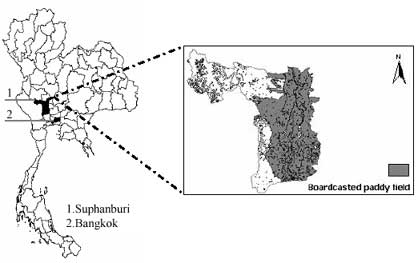
As mention before, the data assimilation technique worked well with synthetic agriculture practice data. In this study the actual application will be investigated with very simple data that is 2 crops/year in large continuous rice field in Suphanburi province, central of Thailand.

Figure 2. Broadcast paddy field in Suphanburi province, central of Thailand
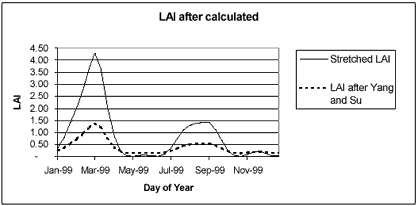
The pixel of 2 crops/year in large continuous field was identified from SPOT Vegetaion NDVI, LMF processed images in year 1999 (figure 3). After the pixel was picked then the LAI data needed for training GA were calculated using NDVI-LAI correlation, (Equation. 1;Yang and Su, 2001). After LAI was calculated the result show that the range was too low (0.142 – 1.380) while the AIT experimental station gives LAI range (0.000-4.300), thus the LAI was rescaled from (0.142 – 1.380) to (0.000-4.300) as shown in figure 4.

Figure 3. The identified pixel from SPOT Vegetation NDVI, LMF processed. 2 crops/year (longitude: 100.008133, latitude: 14.388195)
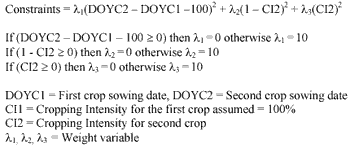
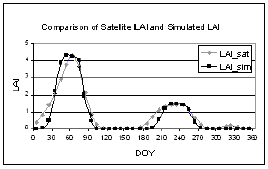
GA randomly creates chromosome, which contain the input parameters for SWAP model, and these chromosomes are tested with the constraints in Equation 2 then LAI output for that combination of parameters were compared with actual LAI base on the objective function (equation 3). The fitness of the chromosomes was evaluated using the fitness function in equation 4. When the result show that it has high fitness or SWAP LAI output is matched/ or nearly matches with the observed LAI, then the processing stops. But if not, GA creates new chromosomes based on the chromosomes from the previous generation as parents for the new generations in the hope that a child will be stronger than parent. The result after applying the data assimilation technique is shown in table 1. The comparison between LAI estimated from SPOT Vegetation Instrument and LAI calculated from SWAP model with parameter identified by this study is shown in figure 5.

Equation 2. Constraints function for Genetic Algorithm.

Equation 3. Objective function for Genetic Algorithm.

Equation 4. Fitness function for Genetic Algorithm.

Figure 4. The result of Stretched LAI and LAI after calculates from SPOT Vegetation NDVI using Yang and Su correlation.

Equation 1. Relational model of LAI using NDVI (Yang and Su, 2001)


Figure 5. The comparison between LAI estimated from SPOT Vegetation Instrument (LAI_sat) and LAI calculated from SWAP model with parameter identified by this study (LAI_sim).
5. Conclusion
From the result, reasonable parameters were successfully estimated and the LAI output from SWAP model is matched with the actual LAI well, although the estimated parameters must be validated in the further study. One of the problems for this study was the estimation of LAI from satellite data; the result showed that the LAI calculated are too low thus in the future, new relationship between NDVI and LAI must be identified. Further, this technique will be tested in mixed pixel environment.
6. Reference
- Goldberg D. E. 1989 Genetic Algorithms in search and optimization and machine learning. Addison-Wesley Publ Co Inc, USA.
- Van Dam, J. C. 2000. Field-scale water flow and solute transport. SWAP model concepts, parameter estimation and case studies. Doctoral Thesis, Wageningen University, The Netherlands.
- Boogaard H .L., Van Diepen C. A., Rötter R. P., Cabrera J. M. C. A. and H. H. Van Laar. 1998. User’s guide for the WOFOST 7.1 crop growth simulation model and WOFOST Control Center 1.5. Technical Document 52, DLO-Winand Staring Centre, Wageningen, The Netherlands.
- Honda and K. and A.V.M. Ines., 2003. Use of RS in quantifying in irrigation water management based on data assimilation technique, p35-p40
- Honda, K. and A.V.M. Ines. 2003. Quantifying agricultural practices in a mixed-pixel environment using Genetic Algorithms.
- Honda, K. and A.V.M. Ines. 2003. A numerical experiment in assimilating agricultural practices in a mixed-pixel environment using genetic algorithms. Proceedings of ACRS-ISRS 2003. Busan, Korea. 3p.
- Reto Stöckli, 2003. Estimating NDVI and LAI with simple radiometric and photographic methods, A remote sensing tutorial for teachers and students.
- Chwen-Ming Yang and Muh-Rong Su, 2001, Correlation of Spectral Reflectance to Growth in Rice Vegetation, Taiwan Agricultural Research Institute.