| GISdevelopment.net ---> AARS ---> ACRS 2004 ---> Data Processing: Data Fusion |
Neural Network for Surface
Current Trajectory Modeling From RADARSAT-1 SAR Data
Maged
Marghany
Laboratory of Physical Oceanography
Institute of Oceanography (INOS)
Universiti Kolej Sains Dan Teknologi Malaysia (KUSTEM)
21030 Mengabang Telipot, Kuala Terengganu,
Malaysia
Email: mmm@kustem.edu.my, magedupm@hotmail.com
Laboratory of Physical Oceanography
Institute of Oceanography (INOS)
Universiti Kolej Sains Dan Teknologi Malaysia (KUSTEM)
21030 Mengabang Telipot, Kuala Terengganu,
Malaysia
Email: mmm@kustem.edu.my, magedupm@hotmail.com
Abstract
This paper introduces a new approach for utilizing the neural network for real time surface current simulation from RADARSAT-1 SAR image. The surface current parameters are collected by using AWAC during the RADARSAT-1 SAR pass over. The neural network input is a vector containing the values of the RADARSAT-1 SAR image intensity gradients. In this paper, a single feed forward -propagation neural network was utilized to estimate the Doppler frequency shift in order to determine the surface current pattern along RADARSAT-1 SAR image. It is found that, the neural network outperformed conventional regression technique in modeling surface current velocity and their directions. The RMS detected from NN model was 0.02 m/s. The reduction of the amount of the errors is due to good performance of regression model.
1.0 Introduction
Recently, scientists and researchers have paid a great attention in utilization of NN in modeling environmental problems. An artificial neural network (NN) can be identified as a mathematical model consists of many non-linear computational elements, named neurons. These neurons are operating in parallel and massively connected by links characterized by different weights. A single neuron computes the sum of its inputs, adds a bias term, and drives the result through a generally nonlinear activation function to produce a single output termed the activation level of that neuron. NN models are essentially specified by net topology neuron distinctiveness, and instruction or information system (Lim et al., 2000).
A key question is how NN cab be used to simulate the current trajectory movements from a single SAR image. The main objective of this study is to exploit the NN algorithm to simulate the surface current movements; in this study, NN based simulation of surface current pattern is demonstrated using the RADARSAT-1 image which simulated from multi-data. The developed NN algorithm is used to obtain spatial distribution of the surface current movements.
2.0 Neural Network Algorithm
Figure 1 shows the basic configuration of NN used in this study, consisting of a network of the interconnected nodes in three layers. The training network was set as hidden layer nodes to compute the surface current movements. The input of the to the NN are the RADARSAT-1 intensity values and final the output being with the surface current velocities and direction. The NN has only one hidden layer, which has been proven to be sufficient for representing any complex problem. Inputs fed to the input layer moved to the hidden layer through weighted connection and then added to a bias. The product is then fed to a non-linear function (termed as, activation function) to modify it. The output from the hidden layer undergoes the same procedure giving the network result at the output layer. This process of obtaining final network output at output node from the applied inputs could be expressed mathematically (Iwata et al., 1989) as in equation 1.
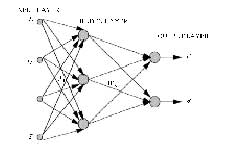
Figure 1. Neural Network Configuration
where, s is the slope parameter, used to adjust the slope of the activation function and adjusted for a particular desired output from the input data. The network out put of the current velocities were compared with in-situ current measurements was feed forward to update the coefficients (e.g. weights and biases) in the network. This process of simulating the input of value of image intensity for outputs is called training or learning of the network and continues until the error decreases to desired value. Since each node in the network has different coefficients, the network can describe any nonlinear relationship. A total of 100 samples of in-situ current measurements and intensity values of RADARSAT-1 image were chosen for modeling surface current from RADARSAT-1 SAR data. Thirty samples are selected for training the network and the rest 70 samples were used to validate data for performance of the trained model. Sorting the input sample set in descending order of the RADARSAT-1 SAR intensity values and in situ current measurements did selection of training data.
The surface current velocity outputs are scaled to the range [0.2 to 0.72 m/s] to match the range of network output. Weights and biases in the network were initialized with small random numbers upon start of training process. The training error is monitored with mean square error. It was found that, the NN over fits the training values if the training is performed until the mean square error flattens down.
Hence, the mean square error of the training-testing set was estimated in each pass of the training and the training is terminated as soon as it becomes the minimum.
3.0 Results and Discussion
Figure 2 shows the comparison of normalized RADARSAT-1 surface current simulation with the ANN model and the in-situ surface current measurements. It is clear that in the scale of (0, 1), the outputs of ANNs coincide basically with the RADARSAT-1 SAR surface current except for several points in some peaks, where the RARDARSAT-1 SAR image intensity not restored accurately due to the shift of the surface current in azimuth direction (Michael et al., 2001) From statistical comparison it is evident that NN out performs regression analysis in calculating the surface current parameters (Figure 3).
Figure 2. Comparison between Normalized Surface Current Estimated from RADARSAT-1 SAR Image, NNs Model and In Situ Measurements
Figure 3. Regression Analysis between In-situ Measurements and Neural network
The regression analysis shows a good agreement between the NN surface current estimation and in situ surface current compared to one estimated directly from RADARSAT-1 SAR image (Table 1) where R 2 is 0.78. In fact, the NN model can recognize the non-linearity of the transfer function of the quasi-linear model, which used as one of the hidden layer. The RMSE is detected from NN model was 0.18 m/s while RMSE is detected from RADARSAT-1 SAR image is 0.33 m/s. The reduction of the amount of the errors is due to good performance of regression models. It is seen that NN could predict the minimum and maximum current speed of 0.19 m/s and 0.72 m/s, respectively. It should be noted that, NN techniques could be sufficient to simulate the surface current from RADARSAT-1 SAR image. This finding is similar to Cramer (1998).
| Model | R 2 | RMS (m/s) |
| NNs RADARSAT-1SAR image |
0.78 0.49 |
0.18 0.33 |
Figure 4 shows the spatial distribution of the current vectors was simulated from NN. This means that during the training phase the net successes in establishing an appropriate mapping that, starting from the set of the computed features, allows to identify the image intensity gradient along the image. This is because the step forward in implementation of the neural net performance consists in the analysis of the gradient intensity of the image backscatter along the selected area.
Figure 4. Spatial Distribution of RADARSAT-1 SAR Neural Network Surface Current
The 3-D maximum current velocity simulated from the CHH band is 0.8 m/s with the northerly current flow along the range direction (Figure 5). This is because that March represents the northeast monsoon period as the coastal water currents in the South China Sea tend to move from the north direction (Maged 1994). The range travelling current is due to the strong non-linearity due to the smaller value of R/V which is 110 s.
Figure 5. 3-D Current Pattern Movements from Neural Network Model
Conclusion
In this study neural network model for RADARSAT-1 surface current simulation has been demonstrated. The ANNs can be used to extract the current vector movements included in their weights and also the outputs of hidden neurons. It is also possible for this approach to be applied to other RADARSAT-1 SAR data. On the other hand, the modification to the approach to enhance the performance of ANN for RADARSAT-1 SAR surface current model is under the consideration and investigation.
References
- Cramer,C., 1998. “Neural Networks for Image and Video Compression: A Review,” European Journal of Operational Research, Vol. 108, pp.266-282.
- Lim,L., Chau,F. and A., Leung,K., 2000. “Compression of Ultraviolet-visible Spectrum with Recurrent Neural Network,” Chemometrics and Intelligent Laboratory Systems, 2000, Vol. 52, pp.135-143.
- Iwata,A., Nagasaka,Y., and Suzumura, N., 1989. “A Digital Holter Monitoring System with Dual 3 Layers Neural Networks,” Proceeding of IEEE International Joint Conf. on Neural Network, pp. II-69– II-74.
- Maged M, Coastal Water Circulation off Kuala Terengganu, Malaysia”. MSc. Thesis Universiti Pertanian Malaysia. 1994
- Michael D. Vachon,P.W., Dobson, F.W., and Oslen, R.B., 2001. “Ocean wave Extraction from RADARSAT Synthetic Aperture Radar Inter-Look Image Cross-Spectra. Transactions on Geoscienceand Remote Sensing,39 (1)21-37.