| GISdevelopment.net ---> AARS ---> ACRS 2004 ---> Data Processing: Data Fusion |
Fusion of LIDAR Data and
Large-scale Vector Maps for Building Reconstruction
Liang-Chien Chen, Chih-Yi
Kuo, Jiann-Yeou Rau
Center for Space and Remote Sensing Research
National Center University
Chung-Li, TAIWAN
Tel: +886-3-4227151 ext 7622, 7623 Fax: +886-3-4255535
E-mail: lcchen@csrsr.ncu.edu.tw, 92322096@cc.ncu.edu.tw, jyrau@csrsr.ncu.edu.tw
Center for Space and Remote Sensing Research
National Center University
Chung-Li, TAIWAN
Tel: +886-3-4227151 ext 7622, 7623 Fax: +886-3-4255535
E-mail: lcchen@csrsr.ncu.edu.tw, 92322096@cc.ncu.edu.tw, jyrau@csrsr.ncu.edu.tw
ABSTRACT
LIDAR data contains plenty of height information, while vector maps preserve accurate building boundaries. From the viewpoint of data fusion, we try to integrate LIDAR data and large-scale vector maps to perform building modeling. The proposed scheme comprises six major steps: (1) preprocessing of LIDAR data and vector maps, (2) extraction of point clouds that belong to a building, (3) construction of the facets from the point clouds, (4) segmentation of planar faces, (5) determination of 3-D boundaries of buildings, and (6) building reconstruction. In the preprocessing of stage, the height variation of the aboveground objects is analyzed and the vertices of a building boundary and the number of stories of the building are obtained. Using the vertex locations and rough heights, the point clouds that belong to a building can be selected. Then a triangulated irregular network is built for representing the facets of the point clouds. Segmentation of planar faces is implemented by considering the angles among surface normal vectors and the minimum area. After detection for planar roof faces, 3-D roof edges are determined by intersecting roof planes. Finally, building models are reconstructed by using SMS method.
1. INTRODUCTION
In response to the development of 3D spatial information for urban planning and management, cyber city is getting more important. In the cyber city, the information of the real world are stored and reconstructed digitally in the computer system. The application of the cyber city is essential, such as in the map revision, change detection, transportation, urban planning, environmental planning [Danahy, 1999], flight simulations [Volz & Klinec, 1999], etc. Because the cyber city is the description of the real world, the spatial analysis in the cyber city could be a reliable reference to city managers.
Building models, among others, could be the most important elements in a cyber city. Thus, building modeling becomes an important task in photogrammetry and GIS areas. Building reconstruction could be divided into two parts, i.e., fully automatic approach and semi-automatic approach. Fully automation is always a substantial goal. Because it is difficult to achieve automatic interpretation, many researches aim at semi-automatic method [Lang et al., 1995; Chio and Wang, 1999]. Building model may be accomplished by using aerial photography such as using CSG model-image fitting [Tseng,2003] and SMS method [Rau & Chen,2002]. Due to its maturity, LIDAR (light detecting and ranging) has demonstrated profound potentials in automatic building reconstruction. Many researches for the building reconstruction are based on LIDAR data in the recent years [Haala & Brenner, 1997; Vögtle & Steienle, 2000; Chen et al., 2003]. LIDAR data contains plenty of height information, while vector maps preserve accurate building boundaries. From the viewpoint of data fusion, we try to integrate LIDAR data and large-scale vector maps to perform building modeling. The workflow of investigation is shown in figure1.
Fig. 1. Work of investigation
2. PREPROCESSING OF LIDAR DATA AND VECTOR MAPS
The procedure starts from resampling the discrete points of LIDAR data into regular grid as digital elevation model (DTM). Then the height variation of the aboveground objects is determined by subtracting the ground elevation from the surface points. In the preprocessing of vector maps, the vertices of a building boundary and the number of stories of the building can be obtained. Using the vertex locations and approximate heights, the point clouds that belong to a building can be selected. Then a triangulated irregular network is built for representing the facets of the point clouds by using Delaunay triangulation [Golias & Dutton, 1997].
3. SEGMENTATION AND DETECTION OF PLANAR FACES
In this step, we implement the planar analysis for the roofs. Various planar faces of the roof should be detected automatically. Thus, the segmentation technique is performed in this step. The region growing and direct segmentation are the two commonly used methods in object segmentation. The first method starts from a seed element, then search adjacent elements to determine if it is similar with the seed element. The seed region is increased as long as the adjacent elements behave similarly. When a region stops grow, a new seed element will be chosen. The region growing is performed correctly when all elements are assigned. The second method computes geometric parameters of all elements first, and then detection of planar faces is applied by clustering. The geometric parameters of elements have been determined to check if any two elements belong to the same region. The parameters of planar equation can be chosen as the geometric parameters. [Vosselman, 1999].
In this investigation, the surface normal vector is selected as the geometric parameters. And segmentation technique we use is region growing.
Once the point clouds that belong to a building are extracted, a triangulated irregular network may be built. The surface normal vector of all triangles of the triangulated irregular network can be determined first. One starts from a seed triangle. If the normal vectors of the seed and its neighboring triangle have similar orientation, we combine the two triangles. The seed region is increased as long as the angle between two adjacent triangles is under a threshold. The reference surface normal vector must be adjusted by using the normal vectors of all triangles that belong to the region. A new seed triangle is chosen as long as there are parts of region have been grown completely. The region-growing step stops when all triangles have been assigned. Because of measuring errors, detected regions consist of noises. Thus, when a region that projection of area is too small, it is ignored.
4. INTERSECTION OF ROOF FACES AND BUILDING RECONSTRUCTION
Polyhedral models are considered in this investigation. In this model, planar faces describe the surface of a house roof. The boundary of a roof planar face consists of two kinds of edges. That means edges may be either common part of the intersection line of two adjacent roof planar faces or part of the contour of the whole roof. The first kind of edges can be computed first by intersection of the planar faces that are adjacent. In this case, we import the information of building boundary from large-scale vector maps. The second kind of edges can be computed by the intersection of the building boundary and the first kind edges, which have been computed previously. Finally, building models are reconstructed by using SMS method [Rau & Chen,2002].
5. EXPERIMENT AND RESULTS
The LIDAR data used in this research are of an area located in Tai-Chung city of central Taiwan obtained by Optech ALTM system. The test area contains 25 buildings. The discrete LIDAR points were classified into vegetation points and ground points. The average density of LIDAR data is about 1.71 points per square meter. The horizontal accuracy is about 0.6m, and the vertical accuracy is about 0.15m. The vector maps are with a scale of 1:1,000.
In the first step, the ground points from LIDAR data are resampled into raster form as DEM with a pixel size of 1m. Fig.2 shows the result that the height variation of the aboveground objects, called nDSM, is determined by subtracting the surface elevation from the DEM
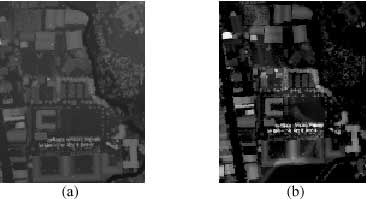
Fig. 2. Steps of Preprocessing of LIDAR data, (a) DSM, (b) nDSM,
In the step of detection of planar face, the angle of the threshold is 10 degree. The selected minimum area is 8m2. The step of detection of planar face for a building in the test area is demonstrated in Figure 3. The step of intersection for the building is illustrated in Figure 4.
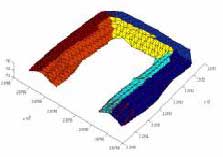
Fig. 3. Steps of detection of planar face
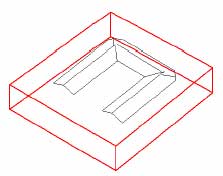
Fig. 4. Result of 3D lines in object space
After combining the 3D lines with SMS method, the building model can be reconstructed. Results of all test area are shown in figure 5. Twenty-four out of twenty five buildings are correctly reconstructed. The building that can’t be reconstructed has many tiny facets that make reconstruction different.
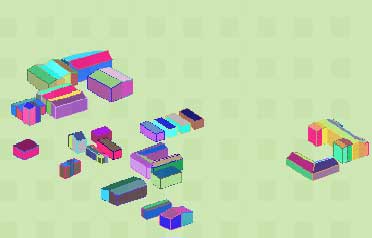
Fig. 5. Result of building models of test area.
Comparing the coordinates of roof corners in the reconstructed models with the corners measured from stereo pairs, the standard deviation are 0.58m, 0.61m, 1.03m in the X, Y, Z components, respectively.
6. CONCLUSIONS
We have presented a scheme for the detection of planar faces and building modeling by performing fusion of LIDAR data and large-scale vector maps. The results from the experiment show the potential of the proposed automatic method. About 96% buildings are correctly reconstructed by our approach. The building models generated by our method take the advantage of high horizontal accuracy from vector maps and high vertical accuracy from LIDAR data. However, we only tested simple type of buildings. The improvements of the scheme for treating more complex buildings are the major ongoing works.
Reference
- Chen, L.C.,Y.C. Lai& J.Y. Rau,2003,” Fusion of LIDAR Data and Aerial Images for Building Reconstruction”, Proceedings of 24 th Asia’s Conference on Remote Sensing,pp.654-656 Chio, S.H., S.C. Wang, 1999,”Semi-automatic system for roof reconstruction based on 3-D linear segments”, Proceedings of the 20 th Asian Conference on Remote Sensing, pp.165-170 Danahy, J.,1999,"Visualization Data Needs in Urban Environmental Planning and Design", Proceedings of the Photogrammetric Week, Karlsrnhe,pp. 351-365.
- Förstner,W.,1999,”3D-city models: Automatic and semiautomatic acquisition methods” Photogrammetric Week’99(D.Fritsch and R.Spiller,editors),WichmannVerlag,Heidelberg,Germany,pp.291- 304
- Golias, N.A. & Dutton, R.W.,1997,“Delaunay Triangulation and 3D Adaptive Mesh Generation”,Finite Element in Analysis and Design, Vol. 25,pp.331-341
- Lang, F., T. Leoecherbach, W.Schickler,1995,”A one-eye stereo system for semi-automctic 3D-building extraction” Geomatics Info Magazine, pp.1-4
- Maas, H.G. & G. Vosselman,1999,”Two Algorithms For Extracting Building Model from Raw Laser Altimetry Data”,ISPRS journal of Photogrammetry & Remote Sensing,Vol.54,pp.153-163
- Peternell, M. & T. Steiner ,2004,”Recostruction of Piecewise Planar Objects From Point Clouds”,Computer-Aided Design,Vol.36,pp.333-342
- Rau, J.Y.,2002,”Geometrical Building Modeling and Its Application to the Ortho- Rectification for Aerial Image” Doctoral Dissertation, NCUCE
- Tseng, Y.H. & S.Wang ,2003,”Semiautomated Building Extraction Based on CSG Model-Image Fitting”,PE&RS,Vol.69,No.2, pp.171-180
- Vögtle, T.& E. Steinle,2000,” 3D modeling of building using laser scanner and spectral information” International Archives of Photogrammetry and Remote Sensing , Vol.33 ,Part B3 , pp.927-934
- VolZ, S.&D. Klinec,1999,"Nexus: the Development of a Platform for Location Aware Application",Proceedings of the third Turkish-German Joint Geodetic Days,Vol. 2,Istanbul,pp. 599-608.