| GISdevelopment.net ---> AARS ---> ACRS 2004 ---> New Generation Sensors and Applications: Digital Camera |
Determination of Aerosol
Optical Thickness from Spectral Sky Transmittance
H. S. Lim 1 M.
Z. MatJafri 2 , K. Abdullah 2 , N. M. Saleh
3 and Sultan AlSultan 4
1 Student, 2 Assoc. Prof. Dr., 3 Mr., School of Physics,
University of Science Malaysia,
11800 Penang, Malaysia
Email: mjafri@usm.my, khirudd@usm.my
Tel: +604-6533888, Fax: +604-6579150
4 Dr., Al Sultan Environmental Research Center. Al Madina Rd., P.O.Box.
242 Riaydh Al Khabra, Al Qassim, Saudi Arabia.
Tel: +966504890977, Fax: +96663340366
Email: allssultan7@hotmail.com
ABSTRACT
The objective of this study is to test the feasibility of the proposed technique for retrieving spectral aerosol optical thickness (AOT) from the spectral transmittance measurements. The measurements have been acquired around Penang Island, Malaysia. Ground-based measurements were made with a handheld spectroradiometer. The measured spectral transmittance data were then converted to AOT values 6 spectral bands between 400 and 900 nm. Spectral AOT maps were generated using Kriging interpolation method for the 6 spectral bands. Air quality map was produced using this technique.
1.0 INTRODUCTION
Knowledge of the parameters that are related to the optical properties of atmospheric aerosols is essential for the determination of their climatic effects, development of techniques for remote sensing of aerosol from space or the necessary correction of atmospheric effects in satellite imagery (Sanchez, et al., 1998). Particulate matter (PM), or aerosol, is the general term used for a mixture of the solid particles and the liquid droplets were found in the atmosphere (Wang and Christopher, 2003). AOT, t, is a measure of aerosol loading in the atmosphere (Christopher, et al., 2002). Generally, a higher AOT value indicates higher column of aerosol loading and therefore low visibility (Wang and Christopher, 2003). The Penang atmosphere is often affected by large plumes of dust especially from the industrial areas.
many researchers have conducted satellite monitoring of the AOT [Husar, et al., (1997), Sanchez Oliveros, et al., (1998) and Liu, et al., (2002)]. In this study, we present results from ground-based measurements. Our purpose is to generated spectral AOT map over Penang. The well knows Beer-Lambert law was used in this study to retrieve AOT values from the measured transmittance value. Finally, AOT maps were generated using Kriging interpolation technique. Ung et al., (2001) and Patil et al., (2003) also applied interpolation technique in their studies (air quality mapping).
2.0 STUDY AREA
The study area is the Penang Island, Malaysia, located within latitudes 5 o 12’ N to 5 o 30’ N and longitudes 100 o 09’ E to 100 o 26’ E (Figure 1). The corresponding PM10 measurements were collected at several selected locations.
Figure 1 Study area
3.0 DATA ANALYSISI AND RESULTS
The data that have been used in this study were collected at 40 locations in Penang, Malaysia. The measured data were transmittance values. The AOT is related to the transmission by the expression
The transmittance values were measured using a handheld spectraradiometer. The sensitivity of this type of spectroradiometer is between the spectral wavelengths from 350 nm to 1050 nm. We selected 6 spectral wavelengths in this study centred at 400.5 nm, 500.5 nm, 600.5 nm, 700 nm, 800 nm and 900 nm. These selected 6 bands are based on the Wehrli 1985 AM0 Spectrum. Then the transmittance values were used to derive the AOT values using Equation (1). AOT maps were created using Kriging interpolation technique for estimating aerosol values to be associated to their distribution patterns (Figure 2).
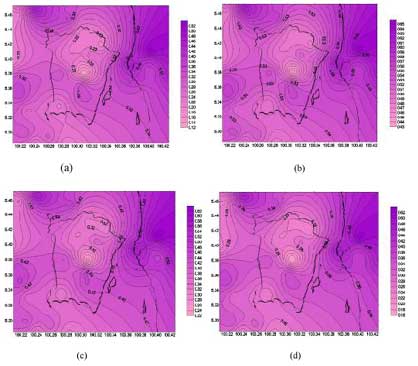
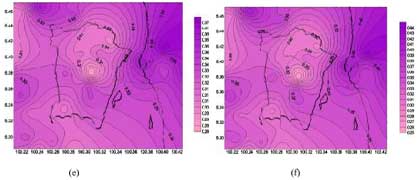
Figure 2 AOT map for (a) 400.5 nm, (b) 500.5 nm, (c) 600.5 nm, (d) 700 nm, (e) 800 nm and (f) 900 nm
In this study, we used PM10 as air quality parameter measurements over Penang Island. The relationship between AOT and PM10 was investigated in this study and we discovered that there was a linear relationship between PM10 and AOT. The linear correlation coefficient (R) was greater than 0.8 (Figure 3). Several studies have indicated linear relationship between these parameter [Christopher and Wang, (2003) and Wang and Christopher, (2003)]. We can clearly see from Figure 3 that PM10 values was increasing as the AOT values increasing. Therefore AOT is a useful information for retrieval of PM 10 values.
Figure 3 A linear correlation between AOT and PM10 (mg/m 3 ) values for (a) 400.5 nm, (b) 500.5 nm, (c) 600.5 nm, (d) 700 nm, (e) 800 nm and (f) 900 nm
4.0 CONCLUSION
This study produced a promising result for AOT mapping. This indicates that the air quality can be retrieved from the spectroradiometer transmittance measurements. This preliminary analysis showed that this technique could be applied to generate an air quality map of a study area.
ACKNOWLEDGEMENTS
This project was carried out using the Malaysia Government IRPA grant no.08-02-05-6011 and USM short term grant FPP2001/130. We would like to thank the technical staff who participated in this project. Thanks are extended to USM for support and encouragement.
REFERENCES
- Christopher, S. A., Zhang, J., Holben, B. N. and Yang, S. K., 2002, GOES-8 and NOAA-14 AVHRR retrieval of smoke aerosol optical thickness during SCAR-B, int. j. remote sensing, 23 (22), 4931-4944.
- Husar R. B., M. Prospero and L. Stowe, 1997, Characterization of tropospheric aerosols over the oceans with the NOAA advanced very high resolution radiometer optical thickness operational product, Journal Geophysics. Research, 102, 16889-16909.
- Liu, G. R., Chen, A. J., Lin, T. H. and Kuo, T. H., 2002, Applying SPOT data to estimate the aerosol optical depth and air quality, Environmental modeling & software, 17, 3-9. Patil, U., Ravan, S. and Kaushal, A., 2003, GIS based air pollution surface modeling, The asian GIS montly, 7 (8).
- Sanchez Oliveros, C., Olmo Reyes, F. J. dan Alados-Arboledas, L., 1998, Determination of aerosol optical thickness from measurements of spectral sky radiance. Journal of aerosol Science, 10, p.p. 1199-1211.
- Ung, A., Wald, L., Ranchin, T., Weber, C., Hirsch, J., Perron, G. and Kleinpeter, J., 2001, Satellite data for Air Pollution Mapping Over A City- Virtual Stations, Proceeding of the 21 th EARSeL
- Symposium, Observing Our Environment From Space: New Solutions For A New Millenium, Paris, France, 14 – 16 May 2001, Gerard Begni Editor, A., A., Balkema, Lisse, Abingdon, Exton (PA), Tokyo, pp. 147 – 151, [Online] available: http://www-cenerg. cma.fr/Public/themes_de_recherche/teledetection/title_tele_air/title_tele_air_pub/satellite_d ata_for_t.
- Vermote, E., Tanre, D., Deuze, J. L., Herman, M. and Morcrette, J. J., 1997, Second Simulation of the satellite signal in the solar spectrum (6S), [Online] available: http://www.geog.tamu.edu/klein/geog661/handouts/6s/6smanv2.0_P1.pdf.
- Wang, J. and Christopher, S. A., 2003, Intercomparison between satellite-derived aerosol optical thickness and PM2.5 mass: Implications for air quality studies, Geophysics Research Letters, 30 (21).
- Wehrli 1985 AM0 Spectrum, [Online] available: http://rredc.nrel.gov/solar/spectra/am0/wehrli1985.new.html.