| GISdevelopment.net ---> AARS ---> ACRS 2004 ---> Data Processing: Change Detection |
Automated Near-Realtime Flood
Detection and Mapping Using Terra Modis
John LOW, Soo Chin LIEW,
Leong Keong KWOH
Centre for Remote Imaging, Sensing and Processing (CRISP)
National University Singapore
Blk. SOC1 Level 2, Lower Kent Ridge Road, Singapore 119260
Fax: (+65) 7757717
E-mail: crslkkj@nus.edu.sg, crslsc@nus.edu.sg, crsklk@nus.edu.sg
Centre for Remote Imaging, Sensing and Processing (CRISP)
National University Singapore
Blk. SOC1 Level 2, Lower Kent Ridge Road, Singapore 119260
Fax: (+65) 7757717
E-mail: crslkkj@nus.edu.sg, crslsc@nus.edu.sg, crsklk@nus.edu.sg
ABSTRACT
A prototype of a near-realtime flood mapping system using TERRA MODIS is being described. This system uses the seven shortwave bands of MODIS with Bands 1 and 2 at 250m and Bands 3 to 7 resampled from 500m to 250m resolution. Having all the bands at the same resolution will help facilitate compositing of the data, visualisation and classification of the data. The seven shortwave bands undergo atmospheric correction, cloud and shadow filtering. The 'good' pixels are composited from Day 1 of each month upto the end of the month over the area of interest. The compositing algorithm preferentially chooses water pixels over the composite period. A supervised Maximum Likelihood scheme classifies the resulting composite to three classes, namely, water, forest and cropland(other non-water, non-forest class). The classified image is compared to another such image of the normal season. The pixels that have changed from a non-water class to the water class indicate high confidence that flooding has occurred. The system was tested with MODIS data over Cambodia and selected SPOT quicklook images were used as ground truth.
BACKGROUND
Floods are an annual occurrence over many countries in the Southeast Asia region. In the event of floods, relief agencies and governments would appreciate timely data of the flood extent for mitigation and assessment. Satellite imagery would be the best resource due to its temporal frequency and wide spatial coverage. Flood occurrence frequently coincides with intense cloud activity and optical sensors like MODIS may not be suitable to provide immediate images of the affected areas. Whilst active sensors like SAR provide cloud-penetrating capabilities to image at the ground surface, the costs and temporal frequency may be a setback and obstacle to lesser developed countries. Notwithstanding, SAR imagery has proven to be very useful in flood detection (Ping Chen, et al 1999).
If delayed access to satellite data is acceptable, then MODIS data would be a low-cost but effective option to flood-mapping. MODIS is a moderate resolution sensor. There are seven optical bands optimised for land imaging, with 2 bands at 250m resolution and 5 bands at 500m. MODIS is availabe on two satellite platforms, namely AQUA and TERRA thereby providing ample opportunities for monitoring of flood activities. Zhan et al (2002) used MODIS 250m bands to detect land cover changes such as floods, deforestation and burnt scars.
PREPROCESSING
In an earlier paper, Low et al (2003) described the processing of MODIS Direct Broadcast at CRISP using NASA algorithms from Level 0 to Level 2. One of the Level 2 products is the surface reflectance product produced from NASA MOD09 algorithm (Vermote et al, 1999). The seven shortwave bands are extracted from this product and reprojected onto Latitude-Longitude grid over the area of interest using another NASA software called MODIS Reprojection Tool Swath. Subsequently, the image is screened for clouds and shadow using a CRISP-developed cloudmask software. This software adapts selected 250m cloud and shadow detection tests from the NASA MOD35 cloudmask algorithm (Ackerman et al, 2002) by optimising the thresholds to the region. However, some amount of cloud and shadow still evade detection and the subsequent compositing algorithm attempts to further reduce such pixels prior to classification.
COMPOSITING ALGORITHM
During a flood event, the region of interest is normally cloud covered and therefore mapping the water area using one single image will not produce desirable results. In fact, during the rainy season, some degree of cloud contamination is inevitable even with one month of images for compositing. Over water pixels, the surface reflectance of shortwave infrared (Band 6) tends to be low. By selecting minimum surface reflectance of this band over the month, the algorithm will select days of flooding. However, shadow pixels also tend to have low surface reflectance in this band, so another criteria was added to reduce selecting the shadow pixels. The compositing algorithm ranks the pixels in order of increasing values of Band 6. Instead of choosing the day with the smallest value in Band 6 i.e. first candidate, it takes the first three candidates and examines the shortwave infrared Band 5 and selects the day with the highest Band 5 of the three days. In this way, both selection of shadows and cloud contamination is further reduced. Of course, this could inadvertently remove some genuine water pixels.
SUPERVISED CLASSIFICATION AND CHANGE DETECTION
The maximum likelihood supervised classification scheme was chosen for its simplicity and performance. Three information classes were chosen, namely, water, forest and cropland (inclusive of urban, bareland, cropland areas). It is relatively simple to discern these classes at the 250m scale. By using a false colour composite of MODIS bands 6, 2 and 1 in red, green and blue respectively, it is relatively easy to select pixels of the three classes. All seven shortwave bands are used for classification. The training pixels are selected over several monthly composites in the Year 2003 to capture the class' varying signatures over different times of the year but still ensuring that the pixel belong to the same class.
For the purpose of this paper, we chose to detect flooding over Cambodia for the Year 2004. A mask of Cambodia is prepared using ENVI software. Using the above-mentioned procedure, monthly composites for the month of February (normal season, Figure 1) and June (wet season, Figure 2) were generated. A supervised maximum likelihood classification using the training data prepared earlier was applied solely over Cambodia (Figure 3).
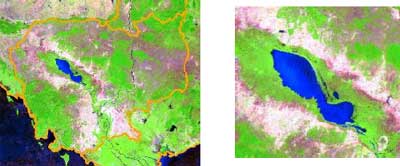
Figure 1. February 2004 composite of Cambodia in false colour (MODIS Bands 7, 2 and 1 respectively). Right image enlarged to show Tonle sap Lake and surrounding flood basin.
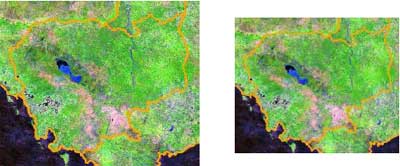
Figure 2. June 2004 composite of Cambodia in similar colour scheme. Black areas over land are cloudy over the whole month. Water areas show as light and darker blue colour in proximity of Tonle sap Lake.
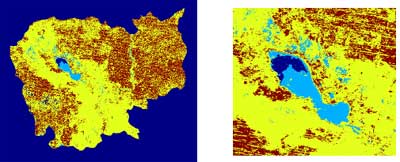
Figure 3. June 2004 classified image with 3 classes, brown-forest, yellow-cropland, light blue-water, dark blue-no data. Classification using a supervised maximum likelihood algorithm.
A simple change detection algorithm was applied to extract areas where the class category changed from either forest or others in February to water in June (Figure 4). Such pixels would indicate flooded areas. These extracted pixels with its geographic location will be overlaid on a map to provide a flood coverage map (Figure 5).
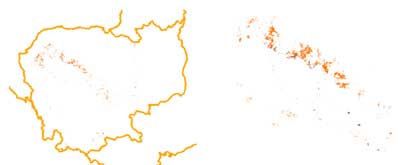
Figure 4. Change detected areas in Cambodia showing highly probable flooded areas. A change occurs when a pixel change from either a forest or cropland class in February 2004 to to water class in June 2004 image.
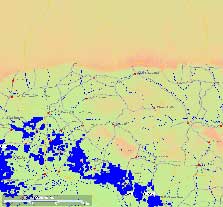
Figure 5. Flood pixels overlaid on a GIS map produced using Digital Chart of the World data.
COMPARISON WITH SPOT QUICKLOOK IMAGES
To ascertain the accuracy of the flood delineated region, the result was compared to available SPOT quicklook browse images. Fortunately, there were some scenes from SPOT4 on the 22 June 2004 which coincided with the flooded area. Indeed, it was found that many of the 'flood' pixels of the June composited image were selected from the 22 June 2004 MODIS pass. An examination of the composite and SPOT4 coincident scenes shows good agreement of the flooded areas (Figure 6).
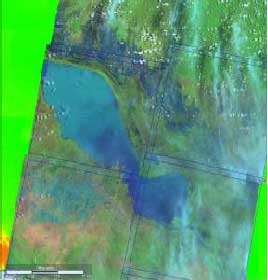
Figure 6. SPOT4 scenes on 22 June 2004 showing Tonle sap Lake and surrounding flooded areas. The flooded areas show good agreement with figure 2. (C) CNES/SPOT Image 2004
DISCUSSION
This study constitutes a part of a program to detect flood in the region on a near-realtime basis using MODIS 250m data. There are several ways to detect floods on a near-realtime basis. One way is to process a single day of passes, do a classification and subsequently do a change detection against a composite of a normal month. However, whilst such a method may work in other regions, in the Southeast Asia region, the result showd large gaps due to cloud coverage and moreover, the flooded area is likely to be obscured by cloud. Alternatively, a composite can be accumulated from day one of each month and a change map can be produced weekly or fortnightly. This will result in fewer data gaps in the composite and less cloud coverage. The disadvantage is less timely flood updates. Moreover, as water pixels are being favourably selected by the composite algorithm among the cloudfree pixels, the composite provides a 'cloudfree' flood map. This may not represent the worst flooding, as that probably have occurred whilst the area was obscured by cloud.
CONCLUSIONS
This study is a precursor to an operational flood mapping system in the region. A supervised maximum likelihood algorithm was used to classify MODIS 250m cloudfree monthly (or periodic) composites of surface reflectances into 3 classes over an area of interest. A change in class type to water class in the latter composite from a 'normal' composite indicate with high confidence flooding had occurred at the pixel. The study showed that change detection using solely single day images produced little useful data due to high cloud coverage over the region. However, accumulating images over a substantial period, up to one month using a compositing algorithm, resulted in more cloudfree pixels and therefore a more useful flood map. Nevertheless, in order to achieve a near-realtime flood monitoring, the flood map can be updated at periodic intervals during the month.
REFERENCES
- Ackerman S, Strabala K, Menzel P, Frey R, Moeller C, Gumley L, Baum B, Seeman S W and Zhang H, 2002. Discriminating clear sky from cloud with MODIS. Algorithm Theoretical Basis Document (MOD35). Version 4.0, October 2002.
- Chen P,Liew S C and Lim H, 1999. Flood detection using multitemporal Radarsat and ERS SAR data. Proceedings of the 20 th ASIAN Conference for Remote Sensing, November 22-25, 1999, Hong Kong, China, Vol 1, pp 1185-1189.
- Low J, Liew S C, Lim A, Chang C W, Kwoh L K, 2003. A Southeast Asia Environmental Information Web Portal. Proceedings of the 24 th ASIAN Conference of Remote Sensing, 3-7 November 2003, Busan, Korea.
- Vermote E F and Vermeulen A, 1999. Atmospheric correction algorithm: Spectral Reflectances (MOD09). Version 4, 1999.
- Zhan X, Sohlberg R A, Townshend J R G, DiMiceli C, Carroll M L, Eastman J C, Hansen M C, DeFries R S, 2002. Detection of land cover changes using MODIS 250m data. Remote Sensing of Environment, Vol 83, pp 336-350.