| GISdevelopment.net ---> AARS ---> ACRS 2004 ---> Data Processing: Automatic Classification |
Segmentation-based Change
Detection Method for Remotely Sensed Images
Chi-Farn Chen, Chun-Shao
Hsu
Center for Space and Remote Sensing Research
National Central University, Chung-Li, Taiwan.
Tel:(886)-3-4227151ext57659 Fax:(886)-3-4264301 Taiwan
E-mail: cfchen@csrsr.ncu.edu.tw, 92322089@cc.ncu.edu.tw
Center for Space and Remote Sensing Research
National Central University, Chung-Li, Taiwan.
Tel:(886)-3-4227151ext57659 Fax:(886)-3-4264301 Taiwan
E-mail: cfchen@csrsr.ncu.edu.tw, 92322089@cc.ncu.edu.tw
ABSTRACT
Land cover/land use change detection has been an important application of remotely sensed images. Unlike the pixel-based c hange detection methods, which normally generate pixel-sized noises, this study develops a segmentation-based c hange detection technique. The main idea of the study is to apply region growing segmentation to multi-dated composite images, and divide the images into many regions. Then a statistical significance test is used to find out the regions that have been changed or not. An experiment is performed to detect the changed areas with remote sensing images, and the result shows that the segmentation-based c hange detection technique can filter out the pixel-sized noises, and offer relatively spotless and area-sized changed map.
1. INTRODUCTION
One of the major applications of remotely sensed images obtained from earth-orbiting satellites is land cover/land use change detection (Hazel, 2001). Because most of the satellite data is repetitively recorded in digital and multi-spectral format, there are many conventional studies focus on the digital techniques for image change detection, such as image differencing method and post-classification comparison method. A critical and tricky element of the conventional methods is the choice of the thresholds between change and no-change pixels that certainly will influence the success of the method. Furthermore, conventional change detection methods normally produce fragmental regions and salt-and-pepper noises due to their pixel-based approach (Singh, 1989). In this study, a segmentation approach is used to develop change detection algorithm for multi-dated remote sensing images. The method firstly composes the multi-dated images as a composite image, then the region growing procedure is used to divide the composite image into numerous regions (Yamamoto, 2001; Lee, 2002). Then each region is statistically analyzed using significance test (Bernard, 1996). Basically, the chi-square values calculated from the gray numbers of each region will be tested for their statistical significance by null hypothesis. Then the region will be evaluated as changed area if the chi-square value is greater than the threshold value under certain confidence level. The following sections will describe the proposed method, test data and results, and conclusion.
2. METHODOLOGY
2.1 Multi-dated composite image
First of all, the remote sensing images acquired at the same location but different dates are grouped together to create a multi-dated composite image. In order to put the image composition into effect, an assumption has to be made that both geometric and spectral disparities between multi-dated images have been properly corrected beforehand. By doing so, a multi-dated composite image will be produced for detecting the changed areas that will be described in the next subsection.
2.2 Region growing segmentation
This study uses region growing approach to perform the image segmentation. Region growing is a procedure that groups the image pixels with similar gray values into regions. It firstly chooses a seed pixel and makes the gray value comparisons with its neighbor pixels. A region will therefore start and grow when the neighbor pixels have gray values similar to the seed pixel and stop when the gray value similarity no more exists. Then another region will begin to grow with new seed. The growing process will continue until all of the pixels have been assigned to their belonging regions.
2.3 Change detection by statistical significance test
The changed or no-changed condition of the regions generated from previous region growing process will be analyzed here. In this study, the gray values of the multi-dated region are statistically analyzed using Chi-square test. The significance of the test is using Chi-square values to test the degree of similarity between two sets of data. Therefore, Chi-square value of each region is calculated for multi-dated images, and is tested for their statistical significance by null hypothesis. The region will be considered as a changed region when the chi-square value is greater than the threshold value under certain confidence level.
3. EXPERIMENT RESULTS AND DISCUSSION
3.1 Simulated images
The performance of the segmentation-based change detection method is tested by using two simulated images. Two images have three spectral bands with size of 219 x 219 pixels. Figure 1 illustrates these two simulated images. Figure 2 demonstrates the result of the change detection obtained from proposed method and the truth map directly extracted from simulated values. The visual observation indicates that the changed map (Figure 2(a)) produced from the proposed method indeed is free from pixel-sized noises, and presents relatively spotless and area-sized changed regions. The accuracy assessment (Table 1) provides a good reference about the performance of the proposed method.
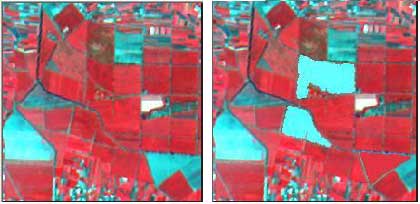
Fig1. Simulated images
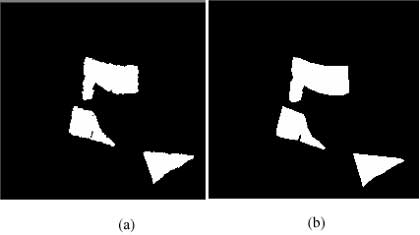
Fig2. The changed maps obtained from Figure 1. White areas represent change. (a) Changed map from proposed method. (b) Truth from simulated values.
3.2 SPOT images
Two SPOT multi-spectral images acquired in October 2003 and December 2003 is used to test the practical application of the proposed method. Two images with the size of 359 x 316 pixels are shown in Figure 3. Figure 4 demonstrates the result of the change detection obtained from proposed method and the truth map directly extracted from ground investigation and the topographic maps. By visual inspection, most of the changed regions detected by proposed method show a fairly consistent appearance with the truth map. In addition, the accuracy assessment (Table 2) also demonstrates a good performance of the proposed method in the practical application test.
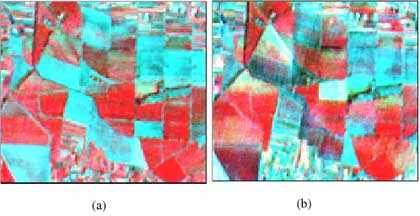
Fig3. SPOT images acquired in October 2003 (a) and December 2003 (b).
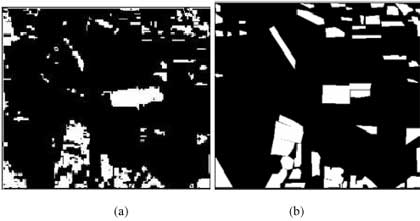
Fig4. The changed maps obtained from Figure 3. White areas represent change. (a) Changed map from proposed method. (b) Truth from ground investigation.
4. CONCLUSION
This study develops a segmentation-based c hange detection technique for multi-dated remote sensing. The main design of the study is to use region growing segmentation to divide the multi-dated images into many regions. Then a statistical significance test is used to find out the regions that have been changed or not. The changed maps produced by proposed method have been compared visually and quantitatively with the truth maps. The results indicate that most of the changed regions detected by proposed method show a fairly consistent appearance with the truth map. Moreover, the accuracy assessment also demonstrates a good performance of the proposed method in the practical application test.
REFERENCES
- Bernard , O., 1996, Engineering statistics the industrial experience Hazel, G.G., 2001 , Object-level change detection in spectral imagery , IEEE Transactions on Geoscience and Remote Sensing , Volume: 39 , Issue: 3 , Pages:553 - 561
- Lee, S., 2002, Change detection in land-cover pattern using region growing segmentation and fuzzy classification, IEEE Transactions on Geoscience and Remote Sensing, Volume: 6 , Pages:3414 - 3416
- Singh, A., 1989, Digital change detection techniques using remotely sensed data., International Journal of Remote Sensing 10(6), Pages:989-1003
- Yamamoto, T., H. Hanaizumi., S. Chino, 2001, A change detection method for remotely sensed multispectral and multitemporal images using 3-D segmentation imagery , IEEE Transactions on Geoscience and Remote Sensing , Volume: 39 , Issue: 5 , Pages:976 – 985