| GISdevelopment.net ---> AARS ---> ACRS 2004 ---> Data Processing: Automatic Classification |
Spreadsheet Programming for
Remote Sensing Image Analysis
Kiyotada SATO
Dept. of Mechanical Engineering
Ichinoseki National College of Technology
Hagisho, Ichinoseki, Iwate, 021-8511
Tel:(81)-191-24-4738 Fax:(81)-191-24-2146
JAPAN
E-mail: satok@ichinoseki.ac.jp
Ryuzo YOKOYAMA
Professor, Dept. of Information & Computer Sciences
Faculty of Engineering
Iwate University
4-3-5, Ueda, Morioka, Iwate, 020-8551
Tel:(81)-19-621-6478 Fax:(81)-19-621-6478
JAPAN
E-mail: yokoyama@cis.iwate-u.ac.jp
ABSTRACT
Spreadsheet program is written by the end-user using dataflow graphs and mapping work. The programming paradigm is effective in the raster image processing. We applied the spreadsheet programming to satellite remote sensing image processing and GIS education and research. In order to achieve for the applications effectively, we have developed image data set, basic dataflow graphs set, and typical template worksheet models for imagery analysis.
1. INTRODUCTION
Programming paradigm of spreadsheet is a mapping by the dataflow graphs(DFG’s,Navarro-Prieto, 2001). The DFG’s programming is an effective method for the operation of the raster image data. We have applied the DFG’s programming to the remote sensing imagery analysis using satellite, geographical and vegetation map images. This paper shows DFG’s programming method and some application for remote sensing image analysis. In order to achieve for the applications effectively, we have developed image data set, basic dataflow graphs set, and typical template worksheet models for imagery analysis.
2. DFG PROGRAMMING OF SPREADSHEET
A Cell expression of spreadsheet shows a relationship of input-output data and contents of operations. The relationship looks like a one-way graph of the dataflow computer programming. For example, NDVI operation program using spreadsheet will be written as shown in Figure 1. In this case, a and b are input images, y is operation output image. NDVI value of y image will be calculated as follows.
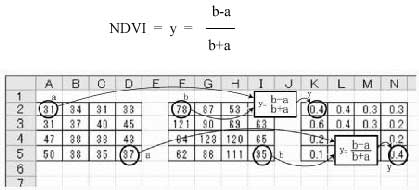
Figure 1. NDVI operation using spreadsheet
Cell K2 expression of the worksheet will be written as follows.
= (F2-A2) / (F2+A2)
The cell expression shows DFG between specified location input tokens of a, b images and output token of y image as shown in Figure 1. The cell K2 expression will be copied from K2 to N5 in square shape. The copy work of the DFG shows mapping from domains a, b to range y. In general, a DFG of spreadsheet is designed to copy in the wide range as shown in Figure 1. In order to maintenance of the mapping work, a DFG is designed so that the structure may become simple. Domain and range data fields of spreadsheet are designed so that the structure may become simple, too. As a result, template model of spreadsheet for a specific problem is developed. The template models of spreadsheet will have typical DFG set, typical data field forms to reuse by specified end-user.
3. DFG FOR REMOTE SENSING IMAGE ANALYSIS
A general purpose DFG for the raster image operation of spreadsheet is shown in Figure 2. The DFG form is multiple neighborhood image operation. Various DFG’s form for raster image operation can derive by the general purpose DFG form.
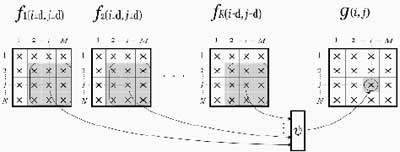
Figure 2. General purpose DFG for remote sensing image analysis using spreadsheet
Figure 3 shows various DFG’s generation and image input control panel using VBA. The control panel generate typical operation sub-control panel for remote sensing imagery analysis, that are point, neighborhood, multiple and statistical operation. All of the DFG’s which generated by the control panel operate to a constant size image data set which developed for spreadsheet image analysis.
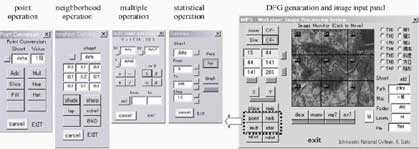
Figure 3. DFG’s generation panel and sub-panel for remote sensing image analysis using VBA
4. DATA SET FOR DFG PROGRAMMING
Figure 4 shows remote sensing image data set for DFG programming (Sato, 2000). The No.3, CSV (Comma- Separated Values) icons are link to 72x62 size image data for operation of spreadsheet. These CSV images data made from original images that location is Iwate prefecture of Japan. These images are precision geometrical corrected, projected to UTM and 30m resolution (Iikura, 1998). The Image data are as follows.
1) Landsat TM images:
Band 1, 2, 3, 4, 5 and 7
2) Topographical maps:
Digital elevation model (DEM) with 0.1m height precision, Slope angle map derived from DEM with 0.1 degree precision, Aspect angle map derived from DEM with 0.1 degree precision, Sunlight incidence angle map derived from above data and incidence and zenith angle
3) Vegetation maps:
Actual vegetation map (1978-1985) edited by Japan Environmental Agency, Land cover map generated from above vegetation map, Automatic classification land cover map made from TM images and land cover map (Sato, 1999).
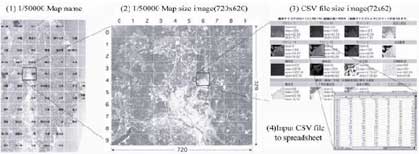
Figure 4. Image data set for DFG operation
5. IMAGE ANALYSIS APPLICATIONS USING SPREADSHEET
Figure 5 shows a multi-level slicing operation result using conditional formatting. The image of 72x62 pixel size on the worksheet can display three colored thematic map. Simple image analysis such a colored image display, profile display and histogram graph display can be achieved using basic function of spreadsheet (Sato, 2001). DFG’s generation and image input control panel has the function to execute the simple image analysis automatically.
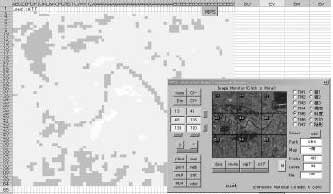
Figure 5. Multi level slicing using conditional formatting
Figure 6 shows NDVI analysis application. In this operation, the result (1) shows a histogram due to logical AND operation between the specific vegetation item area (2) and NDVI value. Changing of the specific vegetation item value will change results, rapidly. These operations are programmed automatically using DFG generation panel as shown in Figure 3.
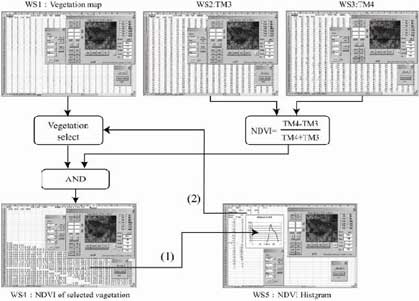
Figure 6. NDVI analysis with selected vagetation area
More complex remote sensing image processing, for example, classification method of maximum likelihood can programmed using DFG’s like Figure 6 is done. In addition, the spreadsheet was used for GIS analysis of urban geography, we have developed the drawing system of the urban area. In these applications, the mapping form of DFG’s also like Figure 6 is done (Sato, 2003).
6. FEATURES AND PROBLEMS
There is no subroutine in the spreadsheet programming. A DFG corresponds to a subroutine of the procedure-oriented language. The spreadsheet does not have looping structure. The mapping work of a DFG corresponds to the looping structure of the procedure-oriented language. Image analysis algorithm expressed by loop structure of the procedure-oriented language replaced the mapping work of the DFG. The DFG mapping solved the annoyingness of the looping structure from the end user. It also solved the annoyingness of the image analysis by the looping structure.
The spreadsheet programming is suitable for the image analysis which is the mapping operation. This programming will be also suitable for the application of the image analysis to which frequently tries and errors. Making response and immediate spreadsheet's cell data visible is useful for the work. The utility of a lot of reused template in a specific purpose is one of spreadsheet's features.
Compared with the procedure-oriented language, there are some problems when the spreadsheet is applied to the image analysis. There is a limit of the image size which can be analyzed. The calculation speed is slow. The image data set for the spreadsheet cannot be acquired. When DFG is large-scale, maintenance becomes difficult.
7. CONCLUSIONS
We reported that the spreadsheet programming was suitable for the image analysis. And we developed basic form of DFG, imagery data set, and template models for imagery analysis. The application example which used them was shown.
The spreadsheet programming paradigm was effective in the raster image processing. However, the paradigm had some potential problems. Especially, it is necessary to note the following two items for maintenance work.
- When structure of a DFG becomes complex
- When mapping size of DFG becomes large-scale
- Iikura, Y., Yokoyama, Y., 1998, Ortho-rectification of Landsat TM imagery and its evaluation. Journal of the Japan Society of Photogrammetry and Remote Sensing, Vol.37, No.4, pp. 12-22
- K.Sato, Y.Iikura and R. Yokoyama, 1999, Automatic category assignment of satellite images using vegetation map. Journal of Remote Sensing Society of Japan, Vol.19 No.4, pp. 40-48
- K.Sato, R.Yokoyama, 2000, Development of data set for analysis of Landsat TM images using WWW browser and spreadsheet, The 21st Asian Conference on Remote Sensing, pp.555-560
- K.Sato,R.Yokoyama, 2001, Teaching Aid for Remote Sensing and Map Imagery Analysis using EXCEL spreadsheet and VBA,Singapore,22nd ACRS,RSE-02
- K.Sato,R.Yokoyama, 2003,Drawing of Concentric Zone Border Line using Landsat TM Images, FA1,Busan,ACRS2003ISRS
- R.Navarro-Prieto, J.J. Canas,2001,Are visual programming languages better? The role of imagery in program comprehension. International Journal of Human Computer Studies, Vol. 54,No. 6,pp.799-829