| GISdevelopment.net ---> AARS ---> ACRS 2004 ---> Data Processing: DEM/3D Generation |
Automatic DEM Generation From
Satellite Image
Leong Keong KWOH, Soo Chin
LIEW, Zhen XIONG
Centre for Remote Imaging, Sensing and Processing, National University of Singapore
Blk. SOC1 Level 2, Lower Kent Ridge Road, Singapore 119260
Tel: (65) 68746557 Fax: (65) 67757717
E-mail: crsklk@nus.edu.sg, crslsc@nus.edu.sg, crsxz@nus.edu.sg
Centre for Remote Imaging, Sensing and Processing, National University of Singapore
Blk. SOC1 Level 2, Lower Kent Ridge Road, Singapore 119260
Tel: (65) 68746557 Fax: (65) 67757717
E-mail: crsklk@nus.edu.sg, crslsc@nus.edu.sg, crsxz@nus.edu.sg
ABSTRACT:
This paper presents a method for automatic Digital Elevation Model (DEM) generation from satellite stereo images. In particular, this paper focuses on DEM generation from images acquired by a variety of satellite platforms. Images acquired by certain satellites, such as SPOT4 and SPOT 5, are provided with ancillary data while some satellites, such as EROS and IKONOS, do not provide ancillary data for their images. Our method of DEM generation supports both of these two kinds of satellite images. The satellite sensor model is built and then refined based on GCPs or tie points in the stereo pairs. This method is also able to generate DEM from images acquired by mixed satellite platforms. In order to improve DEM’s accuracy, an image contrast enhancement method is adopted during image preprocessing. The gradient magnitude images are used in image matching. A relaxation procedure is used to improve the stability of matching result. Accuracy analysis of the results will be presented.
1. Introduction
DEM is one of the most important data used for geo-spatial analysis. Unfortunately, DEMs of sufficient point density are still not available for many parts of the earth, and when available they do not always have sufficient accuracy. Since a DEM enables easy derivation of subsequent information for various applications, elevation models have become an important part of international research and development (R&D) programs related to geo-spatial data (Thierry Toutin, Laurence Gray, 2000) .
So far, researchers have investigated various methods of generating a digital elevation model (DEM) using remote sensing data. One of the methods is to use two images at a time for the reconstruction of a three dimensional stereo model in which the altimetric information can be extracted (Thierry Toutin, 1995). This method generally contains three basic steps: set up sensor mathematical model to reflect the relationship between points on the ground and pixels on the image, do image matching to get a disparity map, and finally calculate each point’s altitude. During these three steps, stereo image matching is the most difficult. For one pixel on an image, its correspondence point on the other image is generally searched in a window by image matching. This window is called search window. If the size of search window is too big, the matching procedure will be very slow and the probability of wrong matching will also be big. But if the search window is too small, the probability of the correspondence point locating outside of the search window will be big. So how to decide the size of search window is very important. Generally we must look for a compromise. Firstly we should assure the correspondence point is within the search window, later on we should reduce the size of the search window as much as possible.
So far different matching method adopts different method to limit the size of search window. VLL (vertical line locus) method (Zhang Zuxun and Zhang Jianqing, 1996) adopts a search window that contains all the possible correspondence points. This window contains the vertical line locus that the altitude range is from the minimum to the maximum. So actually it uses a very large search window. Obviously this matching method is very slow. Because the size of search window is too big, so the probability of wrong matching is very big. The DEM generated with this method always has much noise caused by false matches. Doug C’s hybrid matching model (Doug C. Brockelbank, 1991) uses feature based image matching to extract some seed points firstly, and then uses a cubic polynomials to model the horizontal and vertical disparity of every point. If the seed points distribute normally, the result of this method is good. Otherwise, say in the mountain area, the fitting error of the polynomials may be very big.
Zhang Zhenyou (Zhang Zhenyou and Shan Ying 2001) uses many tie points selected manually to build up a Delaulay triangulation network, and then interpolate every point’s altitude. He uses this method to realize three dimensional reconstruction.
The new method this paper presented is to use an image pyramid to limit search window to a very small region. In order to improve the accuracy of image matching, we use a filter to do local contrast enhancement and generate gradient magnitude image and after image matching, we use a relaxation procedure to improve the stability of image matching.
2. DEM generation method
This section briefly introduces the DEM generation method used in this paper. The procedure of DEM generation is shown in figure 1. We firstly generate geometric sensor model for those images with ancillary data, such as SPOT 4 & 5. Because some high resolution satellite images only provide RPC (rational polynomial coefficients) as geometric sensor model, in order to keep identical with this sensor model, we chose RPC as the final geometric sensor model in the DEM generation procedure. So we must generate RPC for those images with ancillary data. Next step, we should use ground control points or image tie points to refine these geometric sensor models. After refinement, these geometric sensor models can be used in later processing. Before image matching, we do some processing on the original images. In most bright and dark areas, such as mountain area, the lack of features directly leads wrong matching results. We firstly use Wallis filter (Wallis, 1970) for an adaptive nonlinear local contrast enhancement. This enhancement produces good local contrast throughout the image, while reducing the overall contrast between bright and dark areas.
Figure 1, flow chart
After Wallis filtering, the gradient magnitude images are computed. To reduce weak edges due to noise, all gradients with a magnitude less than a threshold T are set equal to T. The threshold is selected as a function of the mean and the standard deviation of the gradient magnitude image (in our program, T=mean-standard deviation). The same function is used for both images to ensure equal treatment. The threshold should not be too high otherwise (a) useful texture is deleted, and (b) the edges are broken and significant differences between the two images occur due to different edge strength. This approach eliminates noise but also low texture which is however not very likely to lead to accurate matching results. (Emmanuel P. Baltsavias, Dirk Stallman, 1993).
After the generation of image pyramid, we do image matching. For each pixel, we do not give its final matching result firstly but a group of matching results with corresponding correlation value. After all pixels have been matched, we do not transfer the matching result to the next pyramid floor immediately but a relaxation procedure (Li Zhang, Maria Pateraki, Emmanuel Baltsavias, 2002). With this relaxation procedure, for each pixel, we select a matching result from the candidate group which is most compatible to its neighbourhoods as the final matching result. After the relaxation procedure is completed, we transfer the matching result to the next pyramid floor and start the next round of image matching. The whole procedure is a iteration procedure till the final pyramid floor.
Finally the matching result was interpolated into DEM whose resolution was defined by user before. We do not need any post processing on this output DEM. The whole procedure is fully automatic.
3. Results and discussions
This SPOT 4 image pair is generated by CRISP. The location of this image is Tailand mountain area. Its center point position is: Latitude: 16.017 degree, longitude: 101.621degree. Figure 2 shows the left image and figure 3 shows the right image.
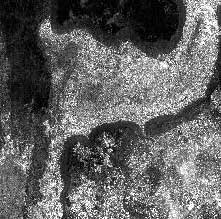
Figure 2, left image
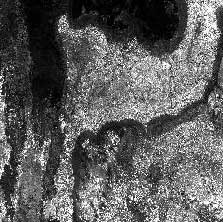
Figure 3, right image
After sensor model refinement, we input the image pair and sensor models, the program generated DEM (figure 4) in one hour. Then we use 126 tie points to check its accuracy. Figure 5 shows its standard deviation is 12.08 meter, its mean error is 10.88 meter.
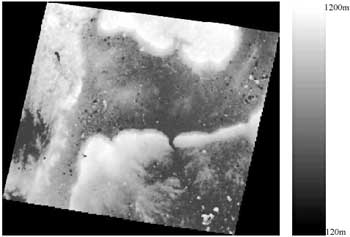
Figure 4, DEM
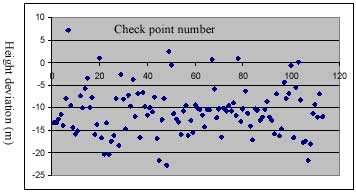
Figure 5, Error distribution
We also use another pair of SPOT 4 images which is located Tailand hill area. Its center point position is: Latitude: 15.018 degree, longitude: 104.314 degree. Figure 6 shows the left image and figure 7 shows the right image.
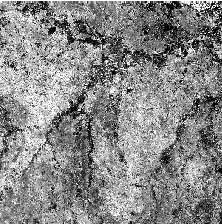
Figure 6, left image
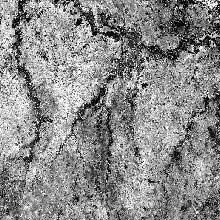
Figure 7, right image
After sensor model refinement, we input the image pair and sensor models, the program generated DEM (figure 8). Then we use 30 tie points to check its accuracy. Figure 9 shows its standard deviation is 13.69 meter, its mean error is 12.78 meter.
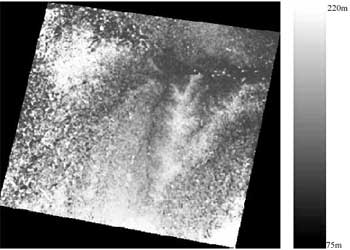
Figure 8, DEM
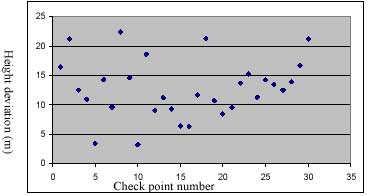
Figure 9, Error distribution
4. Conclusion
We have presented the method of fully automated DEM generation from satellite stereo imagery. From the experiment result and the accuracy assessment, it is apparent that, in terms of geometric accuracy, this method produces an acceptable result for topographic mapping. This method seems can deal with the bright and dark area with rare texture and get a satisfactory result. But its capability should be further tested and improved. For the very big noise, such as thick cloud, this program can not process. Its accuracy also can be further improved. These all are our future work.
References:
- Doug C. Brockelbank. 1991, Stereo Elevation Determination Techniques for SPOT Imagery. Photogrammetric Engineering & Remote Sensing, Vol. 57, No. 8, August 1991, pp.1065-1073.
- Emmanuel Baltsavias, Dirk Stallmann, 1993, SPOT stereo matching for Digital Terrain Model generation. Proc. Of 2 nd Swiss Symposium on Pattern Recognition and Computer Vision, pp. 61-72, Zurich, 1993
- Lee Hae-Yeoun, Wonkyu Park, Taejung KIM, Heung Kyu Lee, Tag-gon Kim. 2000, The Development of An Accurate DEM Extraction Strategy for Satellite Image Pairs Using Epipolarity of Linear Pushbroom Sensors and Intelligent Interpolation Scheme. ISPRS 2000, Amsterdam.
- Li Zhang, Maria Pateraki, Emmanuel Baltsavias, 2002, Matching of IKONOS Stereo and Multitemporal Images for DSM Generation, 2002
- Lu Yihui, Kurt Kubik and Mohammed Bennamoun. 1997, Stereo Image Matching Based on Probability Relaxation. IEEE 1997 TENCON-Speech and Image Technologies for computing and Telecommunications. pp. 315-318, 1997.
- N. AI-Rousan, P.Cheng, etc. 1997, Automated DEM Extraction and Orthoimage Generation from SPOT Level 1B Imagery, Photogrammetric Engineering & Remote Sensing, 63(8): 965-974, 1997.
- Peter Werth, Stefan Scherer. 2000, A Novel Bidirectional Framework for Control and Refinement of Area Based Correlation Techniques. IEEE 2000.
- Rajiv Gupta. Linear Pushbroom Cameras. 1997, IEEE Transactions on Pattern Analysis and Intelligence . Vol. 19, No. 9, 1997.
- Taejung Kim, 2000, A Study on the Epipolarity of Linear Pushbroom Images. Photogrammetric Engineering & Remote Sensing. Vol. 66, NO. 8, August 2000, 961-966.
- Thierry Toutin, 2000, Evaluation of Radargrammetric DEM from RADARSAT Images in High Relief Areas. IEEE Transactions on Geoscience and Remote Sensing . Vol. 38, No. 2, March, 2000.
- Thierry Toutin. 1995, Generating DEM from Stereo Images with a Photogrammetric Approach: Examples with VIR and SAR Data. EARSeL Journal “Advances in Remote Sensing”, Vol. 4, No. 2, pp. 110-117, 1995.
- Thierry Toutin, Laurence Gray. State-of-the-art of Elevation Extraction from Satellite SAR Data.
- Zhang Zhenyou and Shan Ying.2001, A Progressive Scheme for Stereo Matching, SMILE 2000, LNCS 2018, pp. 68-85, 2001.
- Zhang Zuxun and Zhang Jianqing. 1996, Digital Photogrammetry. Publishing House of Wuhan Technical University of Surveying & Mapping. Pp. 168-169, 1996.