| GISdevelopment.net ---> AARS ---> ACRS 2002 ---> Photogrammetry |
Automatic DEM Extraction from
an IKONOS Stereo pair over an Urban Area
Taejung Kim
Satellite Technology Research Center
Korea Advanced Institute of Science and Technology
373-1 Kusung-Dong, Yusung-Gu, Taejon, Korea 305-701
Email: tjkim@satrec.kaist.ac.kr
Yong-Jo Im
Satellite Technology Research Center
Korea Advanced Institute of Science and Technology
373-1 Kusung-Dong, Yusung-Gu, Taejon, Korea 305-701
Email: yjim@satrec.kaist.ac.kr
Abstract:
Automatic extraction of Digital Elevation Models (DEMs) from urban scenes is one of the most active research topics over many years. This paper addresses the experiments carried out to generate DEMs over urban areas from IKONOS images using automated stereo matching techniques. An IKONOS image pair over Taejon city was used for tests. Using ground control points obtained from differential GPS, camera model was set up . The stereo matching algorithm used in this experiment was originally developed for SPOT images at 10m resolution. It was also successfully applied to KOMPSAT- 1 EOC at 6.5m resolution. Although the algorithm used were not designed to overcome the problem of height discontinuities, occlusions and shadows, our intention is to analysis the quality of output DEM using the current technique and to check to what extent a DEM over an urban area can be feasibly extracted. As a result, a DEM over urban areas was produced. Although small houses appear as small “cloudy” patches, large apartments and industrial buildings are visually identifiable. The boundaries of such structures do not produce sharp edges in the output DEM but appear as blurred clouds. However, when an 1:1000 digital map was overlaid to the DEM from IKONOS, the height information around building boundaries could be enhanced. This may suggest that DEMs from IKONOS image can be used for map revision. The DEM was compared with 18 ground control points and showed 6.5m RMS errors. The experiment and analysis in this paper show that 1m resolution satellite images can be used for urban DEM generation together with the existing digital maps and that, however, algorithm improvement is required to handle occlusion, shadows, and height discontinuities .
1. Introducion
Automatic extraction of Digital Elevation Models (DEMs) from urban scenes is one of the most active research topics over many years. Surface characteristics of urban areas, such as shadows, occlusions or height discontinuities, hinder any automated schemes to work in reliable, robust or effective manners. DEM generation over urban areas using ster eo matching, lidar processing, or SAR interferometers all faces difficulties in handling such surface characteristics.
This paper addresses the experiments carried out to generate DEMs over urban areas using automated stereo matching techniques. In particular, this paper will focus on the feasibility analysis of automated DEM generation from the 1m resolution spaceborne IKONOS images. We will generate a DEM over an urban area from an IKONOS stereo pair using stereo matching algorithm developed originally for the SPOT images [Park et al., 2000]. Although this algorithm were not designed to overcome the problem of height discontinuities, occlusions and shadows, our intention is to analysis the quality of output DEM using the current technique and to check to what extent a DEM over an urban area can be feasibly extracted.
IKONOS images over Taejon metropolitan city of the Republic of Korea were used for the experiments. The left and right pair was acquired on the same day of 19th November, 2001. They were precision-geometrically corrected and then resampled to a quasi-epipolar geometry (provided by the courtesy of e-HD. com). The size of each image was 9700 by 9616 pixels and the images were believed to be subtracted from original full-size images. The images cover approximately 8kms by 8kms on the ground. Figure 1 shows the IKONOS image (left) . The image contains dense population of residential houses, apartments and industrial buildings as well as rivers and hills. Automated and reliable DEM extraction from such images is a challenge to any stereo matching algorithms.
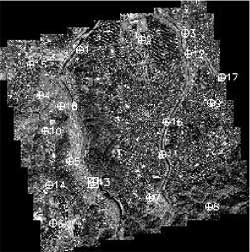
Figure 1. An IKONOS image over Taejon metropolitan city (Left image only). The points with crossed circles were used as control points used for camera modeling and tie points for stereo matching.
2. DEM Extraction Method
This section briefly explains the DEM extraction method used in this paper. The procedure of DEM extraction is shown in figure 2. We first establish camera models for the left and right images. A suitable camera model for IKON OS images is required in this step. In our experiments, we chose the Direct Linear Transformation (DLT) model proposed by Gupta and Hartley [1997] as a camera model. Note that the IKONOS images provided were already geometrically corrected and resampled to a quasi-epipolar geometry. We decided to ignore the transformations previously applied to the dataset and regard the geo-product as raw images, instead of trying to find out all transformations between the original raw images and the geo-product provided and to decide a suitable model given these transformations. Since the DLT is a generalized camera model and does not require any sensor-specific knowledge, camera models of the left and right images could be established. Also it is notable that the DLT is the simplest case of rational function models. Using ground control points obtained from GPS surveying, the left and right camera models were established. These camera models were then used for later processing.
Figure 2. Procedure of DEM extraction experiments carried out
The stereo matching algorithm used here (EpiMatch) was developed originally for the SPOT images [Park et al., 2000]. It was based on the findings on epipolarity of linear pushbroom images [Gupta and Hartley, 1997; Kim, 2000; Kim et al., 2001]. This algorithm utilized the knowledge of epipolar curves of linear pushbroom stereo pairs for the estimation of search regions and the determination of patch shapes. A normalized zero-mean cross correlation was used as a similarity measure. It also utilizes an intelligent scheme to determine initial match candidates. It has been reported that the EpiMatch algorithm worked successfully with SPOT images at 10m resolution and KOMPSAT -1 EOC images at 6.5m resolution [Kim and Im, 2001].
The EpiMatch requires the knowledge of epipolar curves. In our case, there can be two methods of estimating epipolar curves of the IKONOS stereo pair. One is using the camera models established based on the DLT model. The fundamental matrix for linear pushbroom images can be derived from the left and right camera models [Gupta and Hartley, 1997]. The other is simply accepting the input IKONOS data in a quasi-epipolar geometry as in a true epipolar geometry. We tried the both method and did not obser ve much difference. In other words, the quasi-epipolar products of IKONOS scenes were in a reasonable accuracy to apply stereo matching.
Stereo matching output was converted to 3D coordinates and these were interpolated to create a DEM. Although sophisticated interpolation schemes or manual post processing can improve the quality of a DEM, a simple Gaussian interpolation was applied. It was not possible to obtain a dense and accurate ground reference DEM over the test area to test the quality of DEM produced in this paper. We instead compared DEM heights with the height of the ground control points used for camera modeling.
3. Results and Discussions
Firstly, using 18 ground control points (GCPs) measured from GPS surveying, camera models for the left and right images were established. Figure 1 shows the location of GCPs. Table 1 shows the modeling and check errors of the camera models with various number of modeling points. Ths table shows that the errors converged to around one pixels for modeling and to around two pixels for the check error. These figures were slightly larger than those for SPOT or EOC images (Kim and Im, 2001). Without analyzing further the source of additional errors , DEM generation was proceeded.
Table 1. The modeling and check errors of the camera model with various number of modeling points.
Results for left image only are shown.
| No. of model (No. of Check) | 8 (10) | 9 (9) | 10 (8) | 11 (7) | 12 (6) | 13 (5) | 14 (4) | 15 (3) | 16 (2) |
| Model Error (RMSE, pixel) | 0.85 | 1.09 | 1.14 | 1.15 | 1.15 | 1.11 | 1.10 | 1.17 | 1.16 |
| Check Error (RMSE, pixel) | 4.0 | 2.12 | 1.99 | 1.79 | 1.83 | 2.05 | 2.07 | 1.98 | 2.22 |
Stereo matching based on the EpiMatch algorithm was applied to the dataset. The EpiMatch was executed on a MIPS R10000 SGI- IRIX workstation with 128Mbytes memory and at a CPU clock rate of 175Mhz. On this platform, it took 103 CPU minutes in order to match and produce a DEM from the IKONOS stereo pair over the size of 8kms by 8kms on the ground . This number is equivalent to 9.8 msec consumed to match one point. In the reference [Kim and Im, 2001] it was reported that the EpiMatch on the same platform spent about one msec to match one point for SPOT or EOC images. Large processing time was required mainly because larger patch was applied to IKONOS images and partly because more memory space was required to handle the larger image size of IKONOS. Figure 3 shows the DEM generated from the IKONOS stereo pair. The DEM shows that rivers, hills and residential areas could be identified. The 18 GCPs were compared with the DEM for quality assessment. The DEM was shown to possess 6.5m RMS error. Given the resolution of IKONOS images, this error was somewhat disappointing since DEMs from EOC images (6.5m resolution) showed 10m RMS errors or so. This large errors seemed partly due to the failure near the boundaries of buildings as explained later.
Figure 4 shows the urban scenes and the corresponding DEMs at a larger print scale than figure 3. It is very interesting to see that large apartment and industrial buildings are distinguishable from the DEM. It is also possible to detect residential areas. The right images in figure 4 shows, however, that if we zoom in the DEM, the boundaries of the buildings were not very well preserved due to shadow, occlusions or height discontinuities. In many cases, it was difficult to perform stereo match over those parts and accurate height data were missing. Blurred clouds of height data rather than accurate “sharp ” edges were introduced during Gaussian interpolation. This is the current limitation of the DEM generation algorithm used in this paper.

Figure 3. A DEM generated from the IKONOS stereo pair
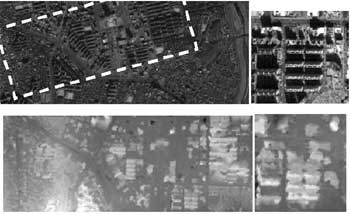
Figure 4. Urban scenes and the corresponding DEMs at a large print scale.
The quality of DEMs in figure 4 was enhanced using the 1/1000 digital map over the same area. The 1/1,000 digital map contained building boundary information (not shown in the paper due to the length limitation). This information was used to enhance the DEM around building boundaries. Figure 5 shows the effect of enhancement. It is interesting to note that the 1/1,000 digital map available in public does not contain any 3D height information of buildings. In this case, DEMs from IKONOS could be used to obtain such information.

Figure 5. An IKONOS DEM over urban scene enhanced by 1/1,000 digital map.
5. Conclusion
This paper reports the experiments on DEM generation from IKONOS images It shows the quality and limitation of the DEM automatically generated and discusses the enhancement of the DEM from IKONOS images. The experiment and analysis in this paper show that 1m resolution satellite images can be used for urban DEM generation together with the existing digital maps and that, however, algorithm improvement is required to handle occlusion, shadows, and height discontinuities .
References
- Park, W., Lee, H. Y., Kim, S.A.B., Kim, T., Yoon, T., Kim, T- G., 2000. Development of DEM generation software from satellite imagery, (CD -ROM) Proceedings of ASPRS 2000 Annual Convention , Washington.
- Gupta, R., and Hartley, R., 1997. Linear pushbroom cameras, IEEE Trans. PAMI , 19(9), pp.963-975.
- Kim, T., 2000. A study on the epipolarity of linear pushbroom images, PE&RS, 66(8), pp.961-966.
- Kim, T., Shin, D., and Lee, Y-R., Development of a Robust Algorithm for Transformation of a 3D Object Point onto a 2D Image Point for Linear Pushbroom Imagery, 2001, Photogrammetric Engineering and Remote Sensing, 67(4):449-452
- Kim, T., Im, Y-J., Automated DEM Extraction from the KOMPSAT- 1 EOC Images, Proc. of ACRS, pp. 1067-1072, November 2001, Singapore