| GISdevelopment.net ---> AARS ---> ACRS 2002 ---> Photogrammetry |
A Study on Digital Orthophoto
Generation of Mount Everest Region
Prof. Dr. Michael Hahn
Vice-President
University of Applied Sciences, Stuttgart
Schellingstrasse 24, 70174 Stuttgart
Fax: +49 711 121 2666
Email: m.hahn.fbv@fht-stuttgart.de
Website: http://www.gisdevelopment.net/www.fht-stuttgart.de
Toya Nath Baral
Program Co-ordinator
Survey Department
Minbhawan-34, Kathmandu, Nepal
Email: tnbaral@ntc.net.np
Rabin Kaji Sharma
Chief Survey Officer
Survey Department
Minbhawan-34, Kathmandu, Nepal
Email: planning@sd.htp.com.np
Abstract
The basic objective of this paper is to present a system pertaining to the photogrammetric processing of high mountainous region, where the elevations difference are extremely high. Therefore, the paper will discuss on the issues of automatic orientation problems of images due to the lack of well-known features in the whole image, extreme height differences and its effect in aerial triangulation. It will also discuss the quality of automatic matching using images with large differences in scale and poor contrast. Furthermore, it will report on the results of orthorectification including tone balancing and mosaicking for a final orthophotomap where the image contains extremely bright and extremely dark parts due to snow and shadows. Assessment of the quality of DTM and an orthophotomap thus produced will be another part of the study.
A digital terrain model (DTM) of the Mount Everest and its surroundings and a set of orthorectified aerial image data was created using photogrammetric workstation (ImageStation). This unique DTM and subsequently digital orthophotomap was created from the aerial image data using commercially available software. Scanning was performed from the transparent originals of second generation in 12 bit color-depth. Orientation procedures followed fully automatic and the densification of control points was performed using modem aerial triangulation procedure.
The study approach heralds a new age for aerial imaging and remote sensing whereby orthorectified image maps can be produced for anywhere without the need for any expensive and time-consuming Ground Control Point acquisition.
1. Introduction
Advancement in digital orthophoto acquisition techniques, lead to continuous growth of orthophoto production. So far none of the tests were performed using digital photogrammetry techniques in an area where the elevation varies (extremely) more than 45% of the flying height above ground level. This study was undertaken as a master thesis program in the university of applied sciences, Stuttgart in collaboration with Z/I imaging, GmbH, Germany. All hardware/software used for the investigation are from the family of ImageStation (joint venture between Zeiss and Intergraph). Here we will, mainly discuss the problems associated with height differences and textures in the images as well as solutions and results. The study area lies on South Asian region and in an antique mountainous country Nepal. Specific area under investigation is the Mount Everest region, well-known highest mountain in the globe, measured from MSL. Curiosity, whether it is possible to perform digital aerial triangulation, automatic extraction of DTM and orthorectify the images with extreme height differences created by high mountains in the study region, lead to formulate this program. We will address the automatic image matching problems arising from the poor textures in the images and big difference in radiometric resolution. Generation of tie points automatically will be the next issue to be discussed. The orthorectification process for the photographs from Mount Everest region requires not only identified ground control points, but also digital terrain models. Hence a DTM needed to be created as part of study project.
This study project aims to demonstrate how automatic triangulation, extraction of DTM, orthorectification and mosaicking can be accomplished automatically.
The editing of digital terrain model is of great importance, because the data is to be used for the production of orthoimages. To carry out this task efficiently, reference data is required (only map data is available) to ensure that the checks can be carried out on significant areas. The manual selection of checkpoints, is both time consuming and prone to error. This paper starts discussing the data available for the study, methods to be used, problems encountered during operation, solutions so far found out and the results.
2. Data for the Study:
Data available for this study are listed and described in table-1. Data available are panchromatic aerial images at a scale of 1:50000. The nature of terrain is highly irregular topography, from steep to very steep and most of the area is covered with snow. The variation of height within the project area is from 2500 meters to 8848 meters, creating extreme elevation differences of more than 45% of the relative flying height in individual models
Table 1, Characteristics of data sets available for Mount Everest-digital orthophoto project.
| Project Name | Mount Everest | |
| Scene Content | Open, snow covered | |
| Scene topography | Steep to very Steep | Most rugged terrain |
| Image Scale | 1:50.000 | Large variation in Scale |
| Camera | Wild RC 30 | GPS onboard |
| Focal Length | 153.19 mm | Calibrated |
| Flight Date | Nov-Dec, 1992 | |
| Film Material | Panchromatic (B/W) | |
| Number of Images | 93=30*90 sq. km | 47 used |
| Overlap | l=80%, q= 40% | |
| Scanner used | Photo Scan 2001 | ZI Imaging’s Product |
| Scanned pixel size | 14 um and 12 bits depth | Per image=728MB |
| Scanned Material | Positive Film | |
| Scanned Channel | Panchromatic | |
| Scan Date | August 2001 | |
| Source | Mount Everest, Nepal | Survey Department |
3. Procedures:
3.1 Aerial Triangulation:
First of all aerial images available in hard film copy were scanned using PhotoScan 2001.The results of scanning were 14um pixel size in resolution, 12 bits CCD data output and full set of overviews. The disk space occupied by one image data came to be 728 MB. These data were loaded to run automatic image matching process. A commercial software called ImageStation Automatic Aerial Triangulation (ISAT 2001 version 3.2-provided by Zeiss-Intergraph Imaging GmbH), was used to perform the automatic orientation of the input images for orthorectification. The final results of this is exterior orientation parameters of the images to be rectified.
3.2 Automatic DTM extraction:
Next step is the derivation of digital terrain model automatically. A surface model is needed for true-orthoimages. This step was performed automatically with ImageStation Automatic Elevation (ISAE). Inputs for the extraction of digital terrain model are the oriented images from.
3.3 Orthorectification:
Now we can use the oriented images for the generation of single orthoimage using the software called OrthoPro. This is rather straight forward and can be done automatically, but the surface model should be edited precisely to eliminate blunders and outliers.
3.4 Production of Orthomosaic:
Finally creation of orthomosaic, tone balancing and seam line hiding is performed in order to end up with a nice looking mosaic. Manual editing is very important to get the optimal position for seam lines in Mount Everest region.
4. Problems Encountered during Automatic Aerial Triangulation:
We encountered serious problems associated with extreme height and radiometric differences during the processing of automatic aerial triangulation. No tie points were generated in extreme bright (reflection of snow) and dark shadow area, because the automatic image matching algorithm could not resolve the problems associated with textures and contrasts in the images.
The other main problem with height difference was to create multi-ray tie points for the stability of the aerial triangulation block. There is almost no connection between the adjoining strips. Table-2 shows the height differences in the project area. We found much more difficulties in automatic matching, even in the single strip due to big differences in height between neighboring images. In strip 54, there is 3500 meters jump from photo no.09 to 08 (49% of relative flying height). In such situation, one more sub block was set up.
4.1 Problems in Matching:
Big problem was encountered in finding homologous patches for image matching due to the bright reflection of snow and dark shadows present in the images. No tie points were created in such an area.
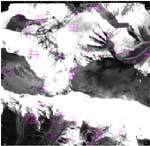 Model 5410-11, Automatic tie points created |
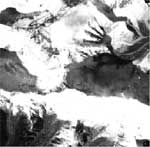 Model 5410-11, Scanned image |
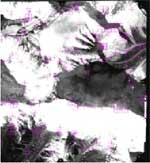 Model 5410-11, after interactive measurement |
 Model 5410-11, Tie point distribution |
4.2 Problems with Height Differences:
Table 2, Percentage of height differences in adjoining strips
| Strip No. | Max.H(m) | Min.H(m) | dH.(m) | Av.Gr.El.(m) | Hg. (m) | % dH/Hg |
| 55 | 8383 | 5383 | 3000 | 6883 | 13500 | 45 |
| 54 | 8848 | 4848 | 4000 | 6848 | 13500 | 60 |
| 53 | 6700 | 4200 | 2500 | 5450 | 13500 | 31 |
| 52 | 7300 | 3200 | 4100 | 5250 | 13500 | 49 |
| 51 | 7100 | 2900 | 4200 | 5000 | 13500 | 49 |
| 50 | 5700 | 2500 | 3200 | 4100 | 12500 | 38 |
| 49 | 4200 | 2400 | 1800 | 3300 | 12500 | 20 |
| 48 | 4000 | 1500 | 2500 | 2750 | 12500 | 25 |
| 47 | 3500 | 2000 | 1500 | 2750 | 12500 | 15 |
Average ground elevation for all strips above is found varying from 15% to 49% of relative flying height with an exception of 60% in strip 54. However an average ground height of 6000 meters was set up in the project and run the automatic image matching process. The algorithm of software was able to create the tie points from strip 55 down to strip 51, but from strip 50 to strip 47, no tie points were generated. When you change the average ground elevation from 6000 meters to 4000meters, the generation of tie points was reversed. But in both cases the block processing was not successful.
Then it was decided to split the block into 2 sub-blocks. The first sub-block was from strip 55 to strip 51, where the average ground height was taken as 6000 meters. The second sub-block was from strip 50 down to strip 47, where the average elevation was taken as 4000 meters. In both the cases, generation of tie points was noticed but the solution was failed.
A number of tests were performed and finally it was decided to process every single strip as one sub block and connect interactively.
Perspective difference in automatic image matching procedure:

Figure 2, Perspective difference in automatic image matching procedure.
Table 3, Generation of multi ray Tie Points
| Vendor | System | Av. Correct TP.Per image | Elim. Blunders | No. of multi ray points in object space | |||||||
| No. | % | Total | 2ray | 3ray | 4ray | 5ray | 6ray | 7ray | |||
| ZI Imaging | ISAT 2001 | 45 | 71 | 3.2 | 2165 | 1132 | 685 | 325 | 15 | 3 | 5 |
5. Summarizing the Specific Problems we get:
- Large scale variation due to extreme height differences, created big matching problem and ended with high residuals.
- Variable overlap created problems with the tie points of the start and end of the strips.
- Erroneous correspondence was established due to bright reflection of snow and dark shadow.
- Measurement of natural control points was found difficult where no signalized points exist.
Matching problems are assigned to that the image can be relatively rotated, images can have different scale, occluded objects, and large variations on radiometric resolution.
Difference in scale means different resolutions and this gives a sharp image in one and the blurred in the other. Rotated image means that one has to resolve the geometrical relationship between images and if automatic procedures failed then the system allows us to measure interactively. Blurred texture present in the image make the correlation almost impossible even in the manual measurement mode.
The matching problem was solved after necessary interactive measurements were carried out and using a robust matching technique i.e FBM which use the technique of describing features to establish correspondence between two images within ISAT.
Matching quality was found much better within ISAT, after exterior orientation parameters were imported, but that did not helped much in adjustment to provide a stable block automatically. However, interactive measurement was necessary for the stability of the block.
System finds erroneous correspondence between images with cloud patches, bright reflection of snow and dark shadow. There is robust estimation algorithm to detect the blunders and eliminate within ISAT, still in this extreme condition of poor textures and big height differences, manual editing is found very effective.
Summarizing the solution, we have
- Interactive measurements of additional tie points and robust matching within ISAT.
- Alternative to that is to import the exterior orientation.
- Measurements of redundant ground control points.
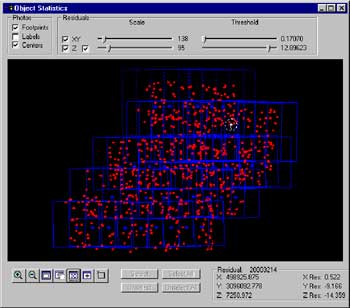
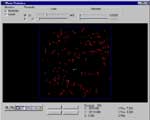
Figure 3, Distribution of tie points within the triangulation block and residual analysis
Result, Bundle Block Adjustment
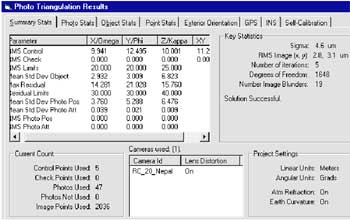
Figure 4, Result of bundle block adjustment
The above result is from an aerial triangulation block adjustment of Everest region. This block initially was prepared using available exterior orientation parameters of all photos of the block. Automatic thinning of the image point was enabled which resulted in less number of image points in the block adjustment. Manual measurements of tie points need experience in Mount Everest region. Experience play very important role to get the block adjustment successful. High residuals in the results are the residuals from ground control point measurements. No control points are signalized and measurements are performed in stereo mode still there is problem to locate exactly the position of natural points. Ground control points are extracted from the existing analogue maps of Everest region. A total of 5 control points were used in the final adjustment (4 in each corners of the block and one at the center of the block) and the adjustment was successful. This was due to the exterior orientation parameters were already used in the adjustment.
8. Digital Terrain Model:
Mass points in a digital elevation model are points on the earth’s surface having known elevation, as well as known positional coordinates. They are used in recitification of aerial image into orthophotos, and in adjusting other data to account for distortions due to terrain slope. During automatic DTM extraction, the following parameters were considered. Terrain type and matching, surface reconstruction, feature pyramid parameters, resampling of matching window, correlation coefficient, threshold for correlation coefficient and threshold for weight
8.1 Accuracy of Extracted DTM:
The accuracy of DTM depends on many factors, so it would be different in various parts of the model. So the single root mean square error may not suffice for the whole area. This would cause many tiles on the rectified images. Manufacturers could take up, is to include in the software some methods of telling the user what to expect in a particular area that is to have a spreadsheet with the terrain slope, flying height and other parameters like the land cover. This could help give an idea of what accuracy to expect in a particular area, thus pointing the way towards resolving the problems of checking DTM quality control. Most of the extreme dark and extreme bright areas due to snow and shadow have no control/tie points/check points which lead to interpolation of DTM data in such an area. Checking during post-processing is a visual check and for this one must find the places where editing is necessary and this takes a lot of time. It took one hour for visualizing the wrong DTM points in one normal model and where there are occluded areas as well as extreme bright and dark areas, it takes even more time. Of course it depends to some extend on the experience and speed of the operators how fast it could be done. It was not necessary to edit all the models, but was important to find out which model has wrong DTM, so it could be edited before importing it for the image rectification purposes. A few models of DTMs generated with different parameters are shown here under for references.
8.2 Discussion of the Results:
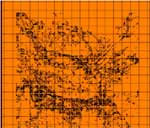 Model 5411-12 (Elevation points) |
 Model 5411-12 (Contour line ) |
Figure 5, Elevation points and contour from 8 bits image
Note: Contours generated using elevation points of the same model. 8 bits/14um pixel size was used for the extraction of DTM in this model. Extraction of DTM started from the center of the model and ended halfway without completing the model.
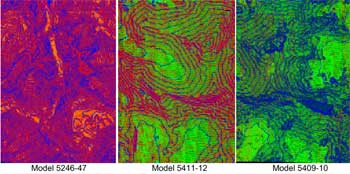
Figure 6, Comparison of DTM extracted from 14 micron and 28 micron pixel from 12 bits image
8.3 Analysis:
Model 5246-5247 was extracted with 14um pixel size and 12bits color depth, where there was no snow area, but the height difference was extremely high. Contour interval is fixed and same for all and is 50 meters. Model 5411-5412 is full of snow and shadow where the scale variation is extremely high. 28um resolution was selected for DTM generation in this model. Model 5409-10 is full of snow and shadow where the scale variation is extremely high. 14um resolution was selected for DTM generation in this model.
Model 5246-47 has no snow area and the DTM extracted there is found comparatively very good even there is extreme height difference (49% of the flying height above ground). Outliers are limited and not significant editing is necessary. Mountains and valleys are distinctly visible in stereo display when contours are overlaid on the image. But in model 5409-10, the DTM was extracted from 14um pixel size and 12 bits CCD data out put, the terrain model there was found very noisy and having much more outliers, which need extensive editing before importing this DTM for rectification. So the neighboring model 5411-12 was again tested to compare the results in the overlapping area, which resulted providing a fairly good DTM. In snow area where we are not much worried about centimeters accuracy and would like to make recommendation to use 2 nd level of pyramids. 8 bits images are not recommended and also 14 um pixel size need not to be used for such an area. Long time processing is another draw back of 14um images. About 5 times more time is required for processing 14 um images than 28 um images in DTM extraction. It took about 30 minutes if you use 2 nd level of pyramids for DTM extraction, but 2hours and 48 minutes was taken when processed with 1 st level of pyramids.
8.4 Editing DTM:
- Editing is found important mostly towards corners and edges of the models caused by extreme height difference and presence of outliers mostly in snow and shadow region. In the corners and edges of the models the perspective is highly distorted and overlap region has different quality of elevation points in different models. So it is most important to have extensive editing in Everest region.
- Method developed practically in editing, was to delete the outliers and wrong elevation points and fill up the gap area by interpolation.
- Experience showed that it took 2 hour to edit one model in average.
- Measurements of control points were carried out to assess the accuracy of the elevation points.
- Contours could be viewed in stereo display over the models to assess the shape of mountains and glaciers.
Digital orthophoto production provided – compared to analogue production techniques – a larger flexibility taking mainly advantage of digital image processing techniques. Furthermore, the digital output opened a larger variety of applications, e.g. in a GIS environment. Both aspects influenced the production workflow changing from analogue to digital, and thus, allowing to take advantage of the inherent capabilities for automation. Looking at the workflow of orthophoto production starting from aerial survey, scanning, aerial triangulation, DTM capturing to orthophoto computation and mosaicking, the orthophoto computation itself is an easy and straightforward task compared to the others.
Parameters considered for the rectification are:
Interpolation method
The pixel spacing.
Transformation type
Clipping inside fiducial marks
Pixel intensity adjustment
File format
Ground resolution.
10. Mosaic:
Figure 7, Sample of mosaic from Mount Everest
10.1 Analysis:
Now all the photos in the project area are rectified and ready for mosaicking to create a seamless image over the whole project area. For mosaicking, first of all seam lines are generated automatically and edited manually. Editing is possible wherever necessary. After placing seamlines satisfactorily on the mountains and valleys and glaciers, they are saved in OrthoPro database.
Next task is to assign mosaic polygons, where it is possible to select which image will fill that area during mosaic processing. Once all the mosaic polygons are assigned and they are saved. Then it is possible to start mosaicking. Here first option is to decide whether tone balancing is necessary, if the sourse for the mosaic is same then it is not necessary. Now the project is selected for mosaic. On completion of the mosaicking process, return to the compatible softwares to view and analyses the final product of the whole process.
11. Conclusion:
With 12 bits image AAT finds enough and fairly distributed tie points in the overlapping areas in Mount Everest region, but automation fails if the height difference exceeds 30% of the relative flying height. The integration of direct exterior orientation measurements in the photogrammetric reconstruction process using GPS/inertial systems might become a standard tool for airborne image orientation in high mountainous region. Nevertheless, in future "true" integrated processing software approaches might be available directly based on the GPS phase measurements and inertial angular and linear acceleration to overcome the problem associated with extreme height and radiometric differences in photogrammetric processing.
References
- Madani, M. and North, S., 1998. MATCH-AT: Some Fundamental Workflow Issues, Automated Digital Photogrammetric Production Environment
- Thomas kersten, Willie O’Sullivan, Nathalic Chuat Swissphoto Vermessung AG Dorfstr. 53, CH-8105 Regensdorf-Wart, Switzerland http://www.swissphoto.ch/
- Proceedings of the OEEPE Workshop on Application of Digital Photogrammetric Workstations, EPF Lausanne, 4-6
- Kersten, Th., O' Sullivan, W., 1996b. Project SWISSPHOTO: Digital orthophotos for the entire area of Switzerland International Archives of Photogrammetry and Remote Sensing, Vol. 31, Part B2, pp. 186-191
- Kersten, Th., Haering, A., 1997b. Efficient Automated Digital Aerial Triangulation Through Customisation of a Commercial Photogrammetric System. International Archives of Photogrammetry and Remote Sensing. Vol. 32, Part 3-2W3, pp.72-79
- Schenk T., 1997: Towards automatic aerial triangulation, ISPRS Journal of Photogrammetry & Remote Sensing (52) 3, 110-121
- Dorstel, C. and P. Willkomm (1994): Automating Photogrammetric Operations and Workstation Design, International Archives of Photogrammetry and Remote Sensing, Vol. 30, Part 3/1, pp. 188-193
- Faust, H. (1989): Digitization of Photogrammetric Images, Proceedings of the 42nd Photogrammetric Week, Stuttgart, pp. 69-78
- F. Ackermann, W. Schneider (1986), High Precision Point Transfer by Digital Image Correlation, Int. Archives of Photogrammetry, Vol. 26-III, p. 18, Rovaniememi 1986.
- Gulch, E. (1994): Using Feature Extraction to Prepare the Automated Meassurement of Control Points in Digital Aerial Triangulation, International Archives of Photogrammetry and Remote Sensing, Vol. 30, Part 3/1, pp. 333-340
- Procededings of ACSM 28th annual meeting, Washington, D.C., March 10-15, pp 253-264. Integration, Automation and Intelligence in Photogrammetry, Remote Sensing and GIS, pp. 49-58.
- Willkomm, P. and C. D^rstel (1994)
- Kersten, th., S., O’Sullivan, W., 1998. Digital Aerial Triangulation in Alpine Regions – A Challenge. Inter-national Archives of Photogrammetry and Remote Sensing. Vol. 32, Part 2, pp. 149-156.