| GISdevelopment.net ---> AARS ---> ACRS 2002 ---> Land Use/Land Cover |
Land cover changes in
tropical rain forest to support sustainable natural production forest
management (SNPFM) in east Kalimantan, Indonesia
Padam
Dahal
Department of Natural Resources
International Institute for Geoinformation Science
and Earth Observation, ITC, 7500 AA, Enschede, Netherlands
Telephone: (31)53-4874-444
Fax: (31)53-4874379
E-mail:Padamdahal@Hotmail.com
Yousif Ali Hussin
Department of Natural Resources
International Institute for Geoinformation Science
and Earth Observation, ITC, 7500 AA, Enschede, Netherlands
Telephone: (31)53-4874-444
Fax: (31)53-4874379
E-mail:Hussin@ITC.NL
Edwin Keizer
Department of Natural Res ources
International Institute for Geoinformation Science
and Earth Observation, ITC, 7500 AA, Enschede, Netherlands
Telephone: (31)53-4874-444
Fax: (31)53-4874379
E-mail:Keizer@ITC.NL
Department of Natural Resources
International Institute for Geoinformation Science
and Earth Observation, ITC, 7500 AA, Enschede, Netherlands
Telephone: (31)53-4874-444
Fax: (31)53-4874379
E-mail:Padamdahal@Hotmail.com
Yousif Ali Hussin
Department of Natural Resources
International Institute for Geoinformation Science
and Earth Observation, ITC, 7500 AA, Enschede, Netherlands
Telephone: (31)53-4874-444
Fax: (31)53-4874379
E-mail:Hussin@ITC.NL
Edwin Keizer
Department of Natural Res ources
International Institute for Geoinformation Science
and Earth Observation, ITC, 7500 AA, Enschede, Netherlands
Telephone: (31)53-4874-444
Fax: (31)53-4874379
E-mail:Keizer@ITC.NL
Abstract
The accelerated rate of deforestation and forest degradation is not only a threat to the continuous supply of forest products for the livelihood of local people living in and outside the tropical forest but it also has many adverse consequences on a regional and global scale. Example can be taken in relation to the loss of biodiversity ,change of the global climate and accumulation of carbon in the atmosphere. These consequences have compelled all the continents and nations to think about the sustainable management of their forest resources. The objective of this study was to assess the land cover change in tropical rain forest using Landsat TM images within a specific period of time and categorize the change on the intensity scale of indicators for sustainable natural production forest management (SNPFM) for timber certification. This study demonstrates how Landsat images can provide timely information required for monitoring to be evaluated using criteria and indicators (C&I) system for sustainable forest management.
Introduction
Sustainable management of natural forests has been a worldwide issue after the United Nation’s Convention on Environment and Development held in June 1992 (UNCED, 1992). Forest certification is a process to determine whether a forest is being sustainably managed or not. For this purpose, certain principles, criteria and indicators are used. Many organizations are involved in development of such principles, criteria and indicato rs at national and international level. In this context, Indonesia has developed its own principles, criteria, indicators, verifiers and verification methods. Indonesian Ecolabelling Institute (LEI) is responsible for that work using the CIFOR C&I system as a base. The criteria and indicators used in this research are from the system developed by LEI (1998). Sustainable forest management is “the process of managing forest to achieve one or more clearly specified objectives with regard to the provision of a continuous flow of desired forest products and services, without undue reduction of its inherent values and future productivity and without undue undesirable effects on the physical and social environment” (ITTO, 1992). This means that, to make a forest management system sustainable it should be economically viable, environmentally sound and socially acceptable. This paper focuses on certain selected criteria, indicators and verifiers of the production function of Indonesian tropical forest. Those selected principle, criteria, indicators and verifiers are shown in Table 1 and are derived from.LEI. The objective of this study was to assess the land cover change in tropical rain forest using Landsat Thematic Mapper (TM) images within a specific period of time and categorize the change on the intensity scale of indicators for SNPFM for timber certification.
| Principle: Sustainability of production Function of the forest. | |
| Criteria 1: Sustainability of forest resources. Indicator P1.3: Size/level of change in forestland cover due toencroachment and conversion of forest area functions, fires and other impediments. |
Verifiers: Area of forest conversion/encroachment.Intensity/frequency and scale of forest fires. |
| Criteria 2: Sustainability of forest products. Indicator P2.5: Condition of residual stands. |
Verifiers: Number and type of regeneration at each level of growth (seedling, sapling, pole etc.). |
Study Area Materials and Methods
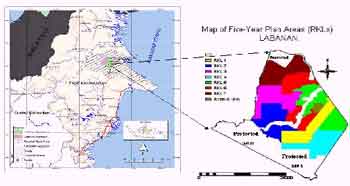
Labanan concession area is found in Berau regency, East Kalimantan, Indonesia. This province is located in the eastern Indonesian part of the island of Borneo. It lies west of the Kelai river. The entire concession area covers about 83,240 ha of which 54, 567 ha is under fixed production, 26,997 ha under limited production and 1676 ha has been left for other uses such as transmigration, camping (by the logging and cruising crew), settlement and agriculture (Fakul tas Kehutanan, 2000). Figure 1 shows the location of the study area. The concession area is managed by P.T. Inhutani I, which is a government owned concession company. The natural vegetation of East Kalimantan is dominated by lowland mixed dipterocarp forest. Dipterocarps represent 50% of basal area and 60% of stand volume. The Berau area is characterized by high botanical diversity of the tree species. Large parts of natural forest in East Kalimantan have been logged.
Two images Landsat-7 ETM+ acquired on 26th August 2000 and Landsat-5 TM acquired on 12th April 1996 were used in this research. The methodology flowchart (Figure 2) explains the general methodology and approach used in this research..Figure 1. Location of study area and the five-year plan (RKL) compartments According to the Indonesian national forest management guidelines an average of 8 trees per hectare are felled at 35-year interval. The forest management unit has been divided into seven five-years working plan areas called RKL (Rencana Karya Limatahun) in local Indonesian language. Thus, the forest concession land in this area divided into 7 RKLs. Each RKL divided into 5 years felling plan. By the end of the felling cycle (35 years rotation) the logging company will start logging again in RKL 1, which was logged 35 years earlier.
Results and Discussions
The color composites (Figure 3) of Landsat-5 TM image of 1996 and Landsat-7 ETM+ image of 2000 with combinations of band 453 in RGB channels shows a comparative view of the land cover classes between the two images. Two newly clear felled areas: one at northwest and another at northeast location of study area for transmigration settlement can be seen. Part of the image of the year 2000 is covered by clouds, which hide part of the transmigration area. These changes did happen after the moment of image recording in the year 1996. The linear shape of the roads and sharp boundary between forest and the clear felled area has formed a pattern that gives an impression of a settlement along with agricultural fields. In these locations agricultural fields are without crops) at the time of data acquisition as the color is cyan. This relates to the high reflectance in band 5 Middle Infrared (MIR) (here in green channel) and band 3 red (here in blue channel) of Landsat TM from bare soil. The area of transmigration settlement at northwest is found to be 567 ha and at northeast is 354 ha giving a total 921 ha which is about 1.11 % of the total area of the forest management unit. The data is shown in Table 2 and the maps in Figure 4. These settlements were established for the people transmigrated from other islands.
Table 2. New land cover classes with their respective areas producted between 1996-2000
| New land cover type | Area change (ha) during 1996-2000 | % Of total area |
| Transmigration settl ement Burnt for shifting cultivation |
921 341 |
0.40 1.11 |
| Clear felled for permanent agriculture | 163 | 0.20 |
| Total | 1425 | 1.71 |
Almost across the centre of study area along east-west direction, a new public transportation road has been constructed which can be seen on Landsat-7 ETM+ 2000 image. This road can only be seen partly in the Landsat-5 TM 1996 image, at the eastern and western part of the study area. It means that the road was under construction at the time of data acquisition of 1996 image, resulting in the removal of trees over the road traject.
When the road construction was completed during 1998-99 (according to local people and forestry staff), there was an initiation of forest clearing and burning for the purpose of shifting cultivation along both sides of that road which can be seen on Landsat-7 ETM+ 2000 image in Figure 3 with zoom in on detail. These clear felled and burnt areas are seen in smooth texture and cyan colour due to dry bare soil. It means that there was no agricultural crop cover at the time of acquiring the image in August, in general the driest month of the year with the minimum amount of rainfall. Sim ilarly, burnt areas can be seen along roadsides near the north-western transmigration settlements. A similar new patch with an area of 111 ha for shifting cultivation is seen at the south-eastern part of the study area, which is also connected to the other public road that passes through the study area across the RKLs 1, 4 and protected area (See Figure 1 for the RKLs map). So it seems that wherever there is public transportation road there is more deforestation through shifting cultivation. Those areas were delineated and found all together to be about 340 ha, which is about 0.4% of the total study area, deforested between the period 1996 and 2000. The areas are shown in Table 2 and locations on Figure 3.
One other cause for the change in the closure of forest cover is due to clear felling of forest for the expansion of land for permanent agricultural. Permanent agriculture here means that the area is continuously used and not left abandoned for sometime like in shifting cultivation system. Such croplands can be seen along both sides of the river in both images. Those areas are floodplains so that agricultural crops such as rice, cassava and banana are suitable to grow. In the TM image these areas appear smooth and light yellow colored due to color combination of high reflectance in band 4 near infrared (NIR) (here in red channel) from the agriculture crops and high reflectance in band 5 middle infrared (MIR) (here in green channel) from the soil exposed in between the agricultural crop plants. Thus, combination of high reflectance in red and green channels is giving the yellow color. In Landsat-7 ETM+ 2000 image there are some new agricultural crop fields, which are not seen in Landsat-5 TM 1996 image. There are two such forest encroachment patches for agricultural expansion seen at south-eastern part of the study area. One more such new patch is also seen at the middle-east corner. All such patches are delineated and shown in Figure 3. The total area of such patches is found to be 163 ha, which is 0.2% of the total area of the forest management unit.
In commercial logging areas the logging roads and skidding trails also create forest canopy openings. But the construction of logging roads and skidding trails is also considered as a part of forest management activity. In Landsat-7 ETM+ 2000 image we can clearly see such road networks in RKL 5, which was logged recently during the period 1996-2000. But such logging road networks have been already covered by forest canopy in other RKLs which are being logged at an earlier stage. This means the forest function along the logging roads is changed only for short period until the logging operation is completed within the particular RKL. So those openings cannot be considered as deforestation.
Therefore, a total of 1425 ha forest cover, which is about 1.71 % of the total area of forest management unit, have been changed to other cover types within the period of four years (1996 to 2000).. If we see it on an annual basis it becomes 356 ha per year, which is 0.43% of the total forest management unit annually. This rate of deforestation is low in comparison to the rate in some other islands of Indonesia..According to WWF personnel the rate of deforestation for agriculture land in Sumatra is up to 5%. This has an implication in determining the position of the indicator number P1.3 on intensity scale of SNPFM. To categorize this indicator as “Excellent” there should not be any forest clearings, change of forest functions, thefts, forest fires and any other forms of impediments. But here we have already found that forest has been cleared for transmigration settlements, shifting cultivation and other agricultural purposes. So we can say that the status of this indicator (P1.3) is not at an excellent category on intensity scale for SNPFM.
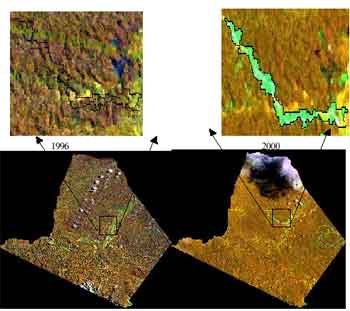
Figure 3. Colour composites with combination of Landsat TM bands 453 in RGB channels.
(Left Landsat-5 TM image 1996 and Right Landsat-7 ETM+ image 2000 with focus at newly burnt area for shifting cultivation focused upward with lines used for delineation). (Note: A=Permanent Agriculture; B=Burnt area for shifting cultivation; T=Transmigration settlement; S=Bare soil on road, etc.) Alternatively if we look at another category “Fair” most of the conditions of the study area match with this category. The forest type and function remains intact despite incidences of forest clearing at some places such as along the public road for shifting cultivation and some areas for transmigration settlements. According to the chief of planning division of Inhutani I, some part of original RKL 2 and most of RKL 3 (altogether about 10000 ha) has been converted into protection area. Similarly the previous RKL1 has been divided into RKL 1 and 3. Even though the forest function has been changed at some places but still those areas are under forest cover. Forest burning is common in shifting cultivation areas, from where there is a high chance of fire spread into the forest. But we could not find the evidences of fire damage on the sample plots inside the forest during the collection of biophysical data. This shows forest burning is mostly confined at the shifting cultivation areas.
Shifting cultivation seems to be one of the major causes of deforestation within the study area. According to the FMU staff, most of those shifting cultivators are the indigenous people and few of them are transmigrants from other islands. Under the decentralization policy, Indonesia’s recent Law No. 22/1999 called law on regional autonomy has also encouraged slash and burn activities. This law acknowledges the diversity of each region and district in Indonesia and the sovereignty of the village as the smallest 1996 2000.governance unit. A village can even create its own regulations and have its own village assembly. Under this law, the local government has allowed the indigenous people to clear the forest on both sides of the public road up to 80 m from the centre and burn it for shifting cultivation (according to the FMU staff). This situation has also affected the long-term guarantee of land to be used as forest by the concession company.
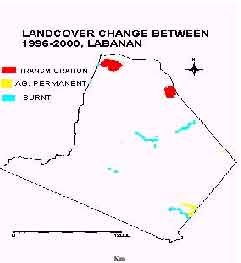
Figure 4. Forest cover change between 1996 to 2000 in the study area.
Thus, due to some change of function while redesigning and some clear felling for resettlement and shifting cultivation of course, the size of production forest area has been a bit reduced. This may reduce the total quantity of annual timber harvest in second felling cycle but the per hectare production can still be maintained the same in the remaining forest. Therefore, despite of the above-explained causes and extent of forest cover changes, the planned mission of the forest management unit can still be continued, which has also been supported by the results obtained from the assessment of indicator number P2.5 “condition of residual stands”. Therefore, the indicator (P1.3) should be categorized as “Fair” on the intensity scale of SNPFM.
If we see the categories on the intensity scale for indicator P1.3, they are subjective and explanatory. If they were quantitative with certain limits for each category, it would be easier for the field assessor to measure and verify the indicators during the process of forest certification. For example, to be scaled as “Excellent” the rate of deforestation should be zero. Similarly, to be “Fair” the limit for rate of deforestation can be put up to the overall average rate within that island or province and the rate should not significantly affect the planned mission of the FMU. To be “Poor” the limit for rate of deforestation could be up to 10%, which changes the type and function of forest so that the planned mission of the FMU should be revised. To be “Bad” the rate of deforestation could be more than 10%, which changes the forest landscape and the corporate vision and objectives has to be changed.
Conclusion
The study concluded that 1425 ha of forest cover, which is 1.71% of total Forest Management Unit (FMU) area, have been changed to other land cover types within the period 1996-2000 in the study area. But this change has not compelled the FMU to change its planned objectives. Thus, the indicator related to the forest cover change is categorized as “Fair” on the intensity scale of indicators for SNPFM. Using remotely sensed data it is possible to detect the changes in land cover types and support the sustainable forest management C&I system for certification.
References
- Fakul tas Kehutanan, 2000. Pelaksanaan Pekerajaan Penyusunan redisain areal hph Wilayah Administratur,
- P.T.Inhutani I(A Final Report on redesigning Labanan Concession area) Berau Kalimantan Timur. Yogyakarta: Universitas Gadjah mada PT. Inhutani I.
- ITTO,1992. Criteria and Indicators for Sustainable Management of Natural Tropical Forests. Lembaga Ekolabel Indonesia, 1998. Forest Certification: Criteria and Indicators. Indonesian Ecolabeling Institute. Available: http://www.lei.or.id/ [2001, 11th December].
- UNCED, 1992. United Nations Conference on Environment and development. Rio de Janeiro: UN.