| GISdevelopment.net ---> AARS ---> ACRS 2002 ---> Land Use/Land Cover |
Microwave Remote Sensing for
Land cover identification
Sununtha
Kingpaiboon
Agricultural Engineering Department, Faculty of Engineering
Khon Kaen University, Khon Kaen 40002 ,Thailand
Tel & Fax 660- 4336-2149;
E-mail: sununtha@kku.ac.th
Agricultural Engineering Department, Faculty of Engineering
Khon Kaen University, Khon Kaen 40002 ,Thailand
Tel & Fax 660- 4336-2149;
E-mail: sununtha@kku.ac.th
Abstract
This study considers the potential application of digital JERS-1 SAR data (L- band, 23.5 cm Wavelength), particularly for land cover monitoring. The SAR data used in this study were acquired on 5 January 1998, 3 April 1998 and 17 May 1998 respectively. These three images available were from the dry season to the beginning of the rainy season. The study area selected is in the province of Khon Kaen, north-east Thailand, which is covered by agricultural land, mainly paddy fields and upland crops. Multi - date SAR data were firstly geocoded to UTM projection, then the data images were scaled from 16 bits to 8 bits. Some filtering and enhancement methods had to be applied in order to reduce speckle noise and to contrast the images. Composite color images were produced for visual interpretation and field surveys. After investigation of the ground truth, representative areas of each land cover type were identified and allocated to the images. The SAR data of training areas were statistically analysed and were classified using Maximum Likelihood. The preliminary results showed that general land cover categories could be well identified, such as water bodies, villages and some lineament features(airfield, road, canal). Separability matrices indicated the confusion between paddy and upland crops, forest and riparian forest. Therefore, SAR data are useful for land cover characterization and for hydrological applications, but a specific methodology for the SAR system needs to be developed.
Introduction
The application of optical data, such as that obtained by LANDSAT and SPOT has a limitation on weather conditions, particularly for cloud coverage during rainy season. Presently, microwave remote sensing (radar system) is available and introduces a new generation of remotely sensed data application. The Synthetic Aperture Radar (SAR), a very high performance, is an active sensor operating in the microwave region. The advantageous characteristics of SAR are weather and sun-illumination independence, cloud and rain penetrating capability and fine resolution. The SAR data, on the other hand, provide substantial information under cloud and haze conditions. These are the major reasons that the SAR data have become popular in mapping land cover. In addition, the visual appearance of the SAR image, such as tone, texture, pattern and shape characteristics can be used in visual interpretation. Microwave is a generic name of electromagnetic spectrum with the wavelength ranging from 1 mm to 1 m. SAR transmits and receives backscattered waves from the ground and land cover (soil, vegetation etc). An amount of microwave backscattered will differ as a function of topography and geometry of surface roughness, height and structure of the vegetation, the amount of soil and canopy moisture, vegetation mass and the differences in the dielectric constant of the objects, therefore, the SAR system observes in terms of volume information.
Many research applications have been done using SAR data for land cover mapping, particularly in tropical countries. Land cover classification is also useful for hydrology in terms of the runoff ratio estimation, the soil moisture and evapotranspiration variation at each land use area. The SAR data have notable potential to monitor and assess hydrological phenomena, such as the extent of surface water, inundated area, flood disaster and a real aridity in a river basin. Hydrological applications of remote sensed data in microwave region have lately attracted attention because of its potential to react to the extent and amount of water that has remarkably high value of dielectric constant in natural material of the earth.
The Japanese Earth Resource Satellite (JERS) was used in this preliminary study. JERS-1 was launched into a sun-synchronous orbit at an altitude of 568 km with a recurrent period of 44 days by the.H- I launch vehicle on February 11, 1992 from the National Space Development Agency of Japan (NASDA), Tanegashima Space Center. JERS- 1 observes and collects data with Microwave Sensor and Optical Sensor (OPS). An optical sensor that measures light reflected from the earth’s surface ranging from visible light to short- wave infrared light. The Synthetic Aperture Radar is an active microwave sensor. SAR has a ground resolution of 18 m x 18 m and observes for a swathe width of 75 km with frequency at 1.27 MHz (or 23.5- cm wavelength, L- band radar), HH polariza tion. JERS-1 objectives are for land surveys, agriculture, forestry, fisheries, environmental and disaster protection and coastal surveillance.
Objective
The aim of the preliminary study is to investigate and to assess the potential application of using digital JERS-1 SAR imagery for land cover identification.
Study Area
The study area is located in the province of Khon Kaen, north- east Thailand (Figure1). It lies between latitude 16°29’ and 16°45’N, and between longitude 102°45’and 103°1' E covering the area of approximately 825 sq.km. The topography of the area covers river terrace, flood plain, low to middle and high terrace, undulating features. The flood plain extends along Pong river. There are villages setting along both sides of river bank. The amount of annual rainfall is approximately 1,200 mm. The major cultivations in this area are paddy and upland crops (i.e, cassava, sugarcane). For mixed orchard and forest, they are found in the higher area. The typical orchard produce is papaya, mango, tamarind and eucalyptus. Vegetation cultivation, particularly cabbages, is carried out on the flood plains beside Pong river. Paddy fields consist of rainfed paddy fields and large area irrigated paddy fields under Nong Wai irrigation project. However, the second rice and vegetables are cultivated in this irrigated area in the dry season.
Data and Materials
- JERS-1 SAR data The three scenes of digital multi-temporal SAR imagery are available on 5 January 1998, 3 April 1998 and 17 May 1998 with path 124 and row 273. (Figure 1)
- Topographic map at a scale of 1:50,000
- Image processing analysis system of PCI EASY/PACE software.
Geometric Correction
These three digital SAR imageries were geocoded against topographic map and registered to a Universal Transverse Mercator (UTM) projection. The SAR data coded on 16 bits for each scene have only a single panchromatic band and have Digital Number (DN) values ranging from 0 to 65,000. This poses a problem to display of the data. Computer monitor generally displays a monochrome image in 256 shades of grey level. Very few details can be made from the original data. Therefore, the SAR data obtained on 16 bits were compressed to 8 bits in order to obtain 256 values of intensity. Then the JERS-1 SAR data were displayed and examined.
Filtering of SAR Data
The objective is to reduce speckle noise of the SAR image. A Frost filter using at 5x5 window size was employed as a spatial filter to the SAR data to remove the speckle noise while retaining the image sharpness.
Image Enhancement
All images were digitally enhanced using histogram equalization in order to increase the contrast of the image.
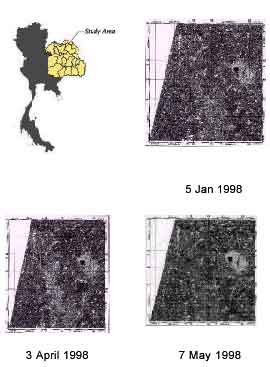
Figure 1. Study area and JERS-1 SAR original data images
Visual Interpretation
Composite color images were generated for visual analysis and for a selection of profiles in representative areas for land cover type classification. The color composite SAR images contained data on 3 April 1998 in red, 17 May 1998 in green and 5 January 1998 in blue. Visual interpretation was investigated on the composite color image, general categories were identified and discussed based on topographic maps at a scale of 1:50,000 made by the Royal Thai Survey Department and other existing data.
Ground Truth Survey
Ground information was collected from field observation and made possible to acquire necessary ground truth for image interpretation, analysis and image classification.
Training Area and Statistical Analysis
The test sites or training areas were selected to get a representative of various land cover types and to have a good ground truth (polygons) available on the images. The statistics of pixel values(unitless) for all categories of training areas were obtained and discussed by mean and standard deviation. The.statistical characteristics of training area for various land cover derived from JERS-1 SAR data are shown in Table 1.
| Land cover type | Image of 3 April 1998 | Image of 17 May 1998 | Image of 5 Jan 1998 | ||||
| Mean | Deviation | Mean | Deviation | Mean | Deviation | ||
| Paddy | 18.375 | 4.529 | 12.816 | 2.947 | 16.159 | 4.367 | |
| Upland crops | 12.153 | 3.232 | 11.927 | 3.371 | 14.212 | 3.816 | |
| Forest | 20.770 | 3.190 | 20.264 | 3.53 | 23.032 | 3.909 | |
| Riparian forest | 19.769 | 4.808 | 15.166 | 3.256 | 21.252 | 5.060 | |
| Village | 45.023 | 21.840 | 34.873 | 15.365 | 46.305 | 21.849 | |
| Water bodies | 7.598 | 1.348 | 5.605 | 1.289 | 8.635 | 1.785 | |
Supervised Classification
Some statistics were calculated for each land cover, for all images as illustrated in Table 1. These three sets of data were used to classify land cover using the Maximum Likelihood method. Digital image processing technique was employed to identify and performed on PCI EASI/PACE software. The procedure of image processing is shown in Figure 2.
Figure 2 General methodology of the digital image processing
Results and Discusion
It was found that the variation of intensity values of all selected images were reduced on the filtered SAR Data compare to its original. Figure 3 presents the composite color image of three original SAR data and figure 4 indicates the same image after filtering with a 5x5window size. The result is that it could reduce certain noise, cause image is smoother and keep lineament detail on the image. Figure 5 presents the composite color image after enhancement and some training area allocation. Statistical analysis for characteristics of the same area for three images taken in almost a dry season showed slight differences in digital number value..The supervised Maximum Likelihood classified results the six main classes as indicated in Figure 6. The results of digital analysis confirmed the capability of SAR data used to separate confusion of categories between village (urban) and water body as well as vegetation canopy condition, however, more details could be observed and discussed as follows:
Vegetation
Backscatte red signals of SAR data are sensitive to vegetation canopy structure in terms of volume. Complex canopy reflects high backscattering to the sensor since it gives a strong roughness characteristic, high signal provides a very bright image. The forest along the river(riparian forest)seems to be not well separated from the forest. They both appear in bright color. Compared to its surroundings, it appears in bright tone on SAR image. Paddy and upland crops appear dark in the SAR image, but there are very bright parts because there are small crop plants in agricultural field. However, they are brighter than the water bodies because crop grows large and wetness in the soil increases radar backscattering.
Water Bodies
Water bodies have a smooth specular surface, hence backscattered signal is very low or no backscattering to the sensor. Consequently, they appear in dark tone on the SAR image.
Village or Urban
In village/urban, very rough object, backscattering detected is very high since its composition is complex. Hence urban areas appear in very bright tone .SAR values in urban are a are equally high in all seasons.
Lineament and Other Man Made Feature
The lineament features, such as roads and canals were clearly seen as dark line. Air field, as it is flat objects, appears in dark zone.
Classification Separability
Resul ts of the overall classification separability could be generally assessed classification in accuracy. The separability matrix is summarized in Table 2.
2.00 = very well separated between two classes; 1.90 = well separated between two classes < 1.70 = low separated between two classes
Land Cover Assessment
The overall results of land cover classification using Maximum Likelihood were calculated and summarized in Table 3.
Conclusion
The results of this preliminary study showed that multi -temporal JERS-1 SAR data could be used for analysis with the expectation of greater advantage for identification of crops types than a single wavelength image. The general result for land cover classification was fairly obvious, superior at distinguishing water and village from other categories, but generally suffered for difficulty distinguishing among forest and riparian forest. Some paddy confused with upland crops. Backscattering is calculated, village is a highest, second is forest, and the lowest is water bodies. Classification using SAR digital image found that land cover in this study area mostly contains upland crops and paddy. Agriculture is still the main important thing for this region. For better results, a deeper understanding of the behavior of the radar backscatter and its relationship to the biophysical parameter is needed. Note that, bright color means high backscatter and dark color means low backscatter to the sensor.
In addition, the electromagnetic interaction with the target is also modified by the object’s dielectric constant. Different characteristics of radar data, the traditional image analysis developed for conventional optical remotely sensed data cannot optimally explore the information content of SAR data. A specific algorithm for SAR classification is needed to be developed..A combination of SAR and optical data would lead to further significant improvement in classification accuracy and provide additional information, especially the cloud- and haze-affected area. JERS- 1 SAR is one of the microwave sensors used to monitor land surfaces because of its capability of penetrating cloud and its high spatial resolution.
Acknowledgement
The author would like to express special thanks to Division of Remote Sensing, National Research Council of Thailand for providing all the digital JERS-1 SAR data used in this study.
References
- Alves,D.,Skole,D.1996.Characterizing Land Cover Dynamic Using Multi -temporal Imagery, 17, pp. 835 -839.
- Kasisehke,E.S.,Melack ,J.M.,Dobson,M.C.1997. The Use of Imaging Radar for Ecological Application. A Review Remote Sensing of Environment, 59, pp. 141-156.
- NASDA, 1992. User’s Guide For JERS-1 SAR Data Formal. Tokyo.
- Nasruddlin,N.,et al.1993. SAR and SPOT Data for Land Cover Mapping. Their Complementary and Integrated Characteristic. Proceeding SAR Data Analysis and Application,Bangkok,Thailand, pp.53- 61.
- Palagonas,M.1993. Land Cover Mapping Using Synthetic Aperture Radar(SAR). Proceedings SAR Data Analysis and Application, Bangkok Thailand, pp. 175- 192.