| GISdevelopment.net ---> AARS ---> ACRS 2002 ---> Land Use/Land Cover |
A study on land use/cover
classification with textural analysis using Multi-Temporal JERS-1 (SAR) L-
band in arid and semi-arid areas.(A case study in Northeastren Jordan)
Hussam AL-
Bilbisi
Ph.D. Student, Center for Environmental
Remote Sensing (CEReS), Chiba University
1-33,Yayoi- cho, Inage- ku, Chiba, 263-8522
Tel: (81) – 43 – 290 – 3965
Fax:(81) – 43 – 290 – 3857
E – mail: mailto:hbilbisi@ceres.cr.chiba-%20u.ac.jp
Japan
Ryutaro Tateishi
Professor, Center for Environmental
Remote Sensing (CEReS), Chiba University
1-33,Yayoi- cho, Inage- ku, Chiba, 263-8522
Tel: (81) – 43 – 290 – 3965
Fax:(81) – 43 – 290 – 3857
E – mail: Tateishi@ceres.cr.chiba-u.ac.jp
Japan
Abstract
A subset of each of the of the JERS-1 SAR L-band images acquired in October 1993, and March 1995, respectively, were used for land use/cover classification purpose in a part of northeastern Jordan area. Textural feature images were generated using JERS-1 SAR L-band 4-look images. These images had been used as input for supervised classification purpose. The accuracy of various classified images had been compared.
This paper describes the methodology and discusses the results for the purpose of textural feature analysis, and land use/cover classification in arid and semi-arid areas (as for the studied area case) using SAR L-band data set.
Introduction
Satellite remote sensing is a useful technique to map land use / cover, where this technique offers unparalleled technique to monitor urban, green and non- green lands changes at regional, global and local scales from space. Although northeastern Jordan is accounted as an arid to semi-arid region, it is dominated by thick blanket of surficial deposits and in some cases haze and clouds can determine the quality of the optical satellite data. However, Synthetic Aperture Radar (SAR) imaging types can provide clear images in all weather conditions and can indeed help in the land use/cover in arid and semi arid areas. In general (SAR) images have speckle noise, which causes salt –and- pepper noise, which in turn affect the classification accuracy of the classified images.
Textural feature images have been widely used in classification to improve the ability to discriminate objects (Takashi et al. 2001). Therefore textural analysis may be a powerful tool for improving the classification accuracy. Various textural measures have been investigated for estimating the performance of textural analysis.
In this study, and by using JERS-1 (SAR) L- band, we investigate a method to evaluate the accuracy of the land use/cover classification using the original, smoothed and textural feature images in arid and semi-arid areas.
Study Area
The study area (Fig.1) is located in the northeastern of Jordan, and includes a small city named rewaished. It lies between the latitude 32°15' 22' and 32°50' 17' North and longitude 37°56' 05' and 38°39' 11' East. The prevailing climate is hot and dry during summer and very cold during winter; with average rainfall reaches 100mm (20 years average) and high rate of evaporation (Meteorological Dept. of Jordan, 2002).
The area is considered poor in plant cover since there are no natural forests there. Many farms exist in this area depend on irrigation water, most of them are used for vegetables production (ground crops) and the others are cultivated by olive trees. While the herbaceous grazing lands such as Artimisia Alba, Rattamus and others are rain- fed types. (The Hashemite Kingdom of Jordan, 1991).
Soil in the studied area is derived from limestone rocks or limestone accompanying with basalt rocks in some areas. The most important characteristics of this soil are high rates of silt and calcium carbonates. Salinization and gypsum increased towards eastwards. The low level of organic matter and the formation of the surface cause high rates of erosion by wind and water. The main types of soil prevailing in the areas below an inclination level of 10% are aridsols and entisols in steeper areas (The Hashemite Kingdom of Jordan, 1991).
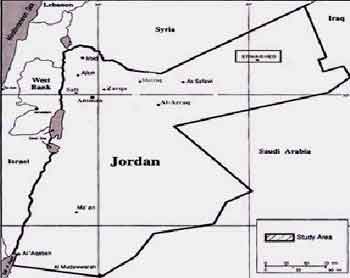
Figure 1: Location of the Studied Area
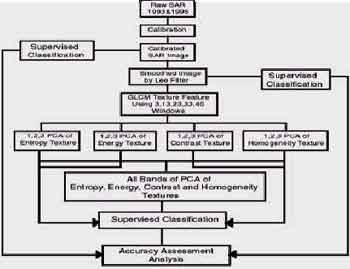
Figure 2: Methodology of the Study
Methodology
Figure 2 shows the general methodology of this study. A subset of each of the of the JERS- 1 SAR L-band images acquired in October 1993, and March 1995, respectively, covering the studied area which is a part of the northeastern Jordan, including rewaished city (Fig. 1) were used. The digital images were geometrically and radiometrically calibrated to each other to facilitate their comparison. An important component to SAR data is the speckle noise reduction; a characteristic feature of SAR imagery is the presence of speckle (Ulaby et al. 1986). This effect originates from the way in which the electromagnetic radiation is produced by the sensor and how it interacts with the target. Consequently, speckle reduction is a useful first step in the processing of SAR data. Images were georeferenced to UTM E012 of WGS 1984.
The textural features generated images (in this study) were those used in previous studies (e.g. Takashi et al. 2001, Ulaby et al. 1986, and Holmes et al. 1984). The textural features used were Contrast, Energy, Entropy and Homogeneity. The displacement vectors to obtain the Gray Level Co-occurrence Matrix (GLCM) needed to calculate the textural features were (1,0þ), ( 1,45þ), (1,90þ) and (1,135þ) in (d,þ), where d denotes the distance and þ denotes the angle. Each textural feature was obtained by averaging four values calculated from GLCMs corresponding to the above four directions, the four textural features were calculated at each pixel in each text ure image.
The original SAR data, for both dates were geometrically calibrated to each other; then smoothed images were generated by using Lee filtering from the original SAR data, and used to drive the GLCM textural features images, both original and smoothed images were used as in put for maximum likelihood classifier (Fig.2).
The GLCM textural features images (Contrast, Energy, Entropy and Homogeneity) were generated using 3,13,23,33 and 45 windows, and were used also as in put for the maximum likelihood classifier with Principal Component Analysis (PCA). PCA is a statistical technique that rotates the axes of a multi dimensional image space in the direction of maximum variance. The components or axes generated by this rotation are simple linear combinations of the original image data, or orthogonal to each other and, thus, have no mathematical relation (i.e., their correlation coefficient is approximately zero) (Kwarteng and Chavez, 1997). Classification of SAR L- band pixels were clustered into five basic land use/cover classes using (Sato-Tateishi, land cover legend, personal communication, 2002), these classes are: 1- spares herbaceous/shrub, 2- hardpan, 3- gravels, stones and boulders, 4- bare rock and 5- bare soils and other unconsolidated materials.
Results
Figure 3 shows the results of the classification accuracy for the original SAR images , the smoothed images and the textural features images. The results indicate that for the original images the over all accuracy is unsatisfactory; where it is 53% and 56% for 1993 and 1995, respectively, and for the smoothed images the speckle noise is reduced and the over all accuracy is a little bit improved , where it is 63% and 69% for 1993 and 1995, respectively.
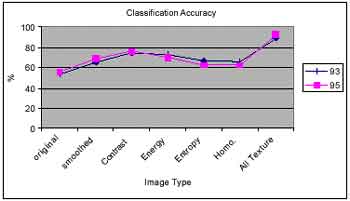
Figure 3: Classification Accuracy Results.
If the over all accuracy of the textural features images is compared, the contrast images give the best accuracy for both dates, where 75% and 76% had been obtained for 1993 and 1995, respectively, the energy images second with 73% and 70% for 1993 and 1995, respectively, the entropy images third with 67% and 63% for 1993 and 1995, respectively and the Homogeneity images give the worst over all accuracy results, where 66% and 62% had been obtained for 1993 and 1995 respectively. The combination of all textural features images give the best over all accuracy results where 89% and 93% had been obtained for 1993 and 1995, respectively (Figures 4 and 5)
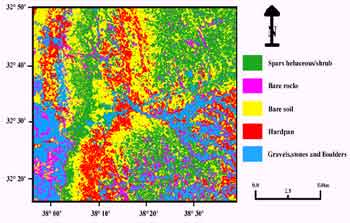
Figure 4: Supervised classification results(SAR 1993)
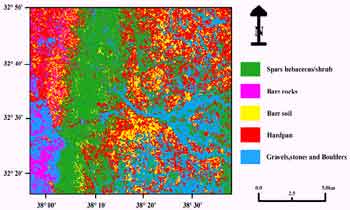
Figure 5: Supervised classification results (SAR 1995)
Conclusion
The objective of this study was to investigate the performances of the textural features images. It was found that the textural features generated images improved the classification accuracy, for the arid and semi-arid areas, more than that of the original SAR images and their smoothed images. The combination of all textural features images give the best over all accuracy results. Nevertheless, textural features analysis is important because it can improve the classification accuracy in arid and semi-arid areas.
Reference
- Holmes, Q. A., Nuesch, D. R., and Schuchman, R. A., 1984: Textural analysis and real-time classification of sea-ice types using digital SAR data. IEEE Transaction on Geoscience and Remote Sensing, GE- 22, pp. 113-120.
- Kurosu, T., Fujita, M., and Chiba, K., 1997: The identification of rice fields using multi-temporal ERS-1 C-band SAR data. International Journal of Remote Sensing, 18, pp. 2953-2965.
- Kurosu T., Yokoyama, SHI., and Fujita, M., 2001: Land use classification with textural analysis and the aggregation technique using multi-temporal JERS-1 L -band SAR images. International Journal of Remote Sensing, 22, No. 4, pp. 595 -613.
- Kwarteng, A. Y., and Chavez, P. S., JR., 1997. Change detection study of Kuwait City and environs using multi -temporal Landsat Thematic Mapper data. INT. J. Remote Sensing, vol.19, No. 9,pp. 1651- 1662.
- National Information System (NIS). 1999. The official web site of the Hashemite Kingdom of Jordan database. http://www%20.nis.gov.jo/ and http://www.dos.gov.jo/.
- The Hashemite Kingdom of Jordan. 1991. National Strategy for Jordan. Ministry of Municipal and Environment, Amman -Jordan.
- Ulaby, F. T., Kouyate, F., Brisco, B., and Williams, T. H. L., 1986: Textural information in SAR images. IEEE Transaction on Geoscience and Remote Sensing, GE- 24, pp. 235 -245.