| GISdevelopment.net ---> AARS ---> ACRS 2002 ---> Land Use/Land Cover |
Reconstruction of long term
land cover changes by a maximum likelihood interpolation method using
genetic algorithm
Masahiko Nagai, Ryosuke
Shibasaki, Huang Shaobo
Center for Spatial Information Science, University of Tokyo
Cw-503, Block C, 4-6- 1 Komaba
Meguro- ku, Tokyo 153-8505, Japan
TEL & FAX: +81- 3- 5452- 6417
E mail mailto:nagaim@iis.u%20-%20tokyo.ac.jp
Japan
Center for Spatial Information Science, University of Tokyo
Cw-503, Block C, 4-6- 1 Komaba
Meguro- ku, Tokyo 153-8505, Japan
TEL & FAX: +81- 3- 5452- 6417
E mail mailto:nagaim@iis.u%20-%20tokyo.ac.jp
Japan
Abstract
Even though long term land cover change is very important in various fields such as global environmental studies, only fragmentary data has been available. The interpolation method is applied to reconstruct long term land cover changes from fragmentary observational data and knowledge of the changes. Genetic- Algorithm (GA) is used as interpola tion method. This method is very advantageous when the density of observational data is low because it can create most probable spatio-temporal distribution of class variables under the fragmentary observational data and behavioral models.
Introduction
- Introduction
It is very important to have an adequate knowledge of long term land cover change for understanding what is happening in the present and may happen in the future. Human activities have modified the natural environment significantly, while it has recently become clear that during the last centuries the intensity and scale of these influences have increased very much. Although long term land cover change is very important, only fragmentary data has been available. The maximum likelihood interpolation method using genetic algorithm is applied to reconstruct long term land cover.
- Introduction of genetic algorithm(GA)
Genetic algorithm (GA) is the search algorithm that is based on the mechanisms of natural selection and evolution of natural genetics. The approach combines survival of the fittest among string structures. Genetic algorithm is computational simple and powerful in their search without restrictive assumptions about search spaces. In a simple genetic algorithm , five basic aspects are considered ; the representation or coding of the problem, the initialization of the population, the definition of the evaluation function, the definition of genetic operators, and the determination of parameters.
- Optimization scheme for nominal variable
interpolation
Most of natural properties change along a continuous scale. Spatial continuity and temporal continuity give rationale for interpolating fragmentary observational data. There are many models now for knowledge and rules governing spatio-tem poral patterns and behavior of geographic objects. They can provide more robust and quantitative basis for interpolating observational data. Reliability of result estimated from model simulation can be improved by combining reliable observation data. It is reasonable to assume that spatio- temporal events or the voxel- field of nominal variables should maximize likelihood under give observational data and behavioral models. Observational data and behavioral models can be integrated in the process of maximizing the likelihood of spatio-temporal events. Genetic algorithm is applied as a optimization scheme because searching for the most likely spatio-temporal or voxel-field of nominal data is a typical combinatorial optimization problem.
- Input Data
1) History database of the global environment (HYDE) In this study, History Database of the global Environment (HYDE) is used for input data, such as potential and actual land cover data and fragmentary observational data. This datar, HYDE, has natural background vegetation based on the BIOME model (Prentice et al, 1992). The biome model of Prentice et al. (1992) is the first used to select which plant types may potentially be present at a particular site. This rule-base captures the effects of minimum tem perature tolerances and chilling requirements on determining the distributions of different plant types.
2) Land cover data at the start year and the end year: In this study, year 1700 of HYDE is used as a land cover data at the start year and year 1990 of HYDE are used as a land cover data at the end year. In land cover data at the start and end year, agriculture land, pasture, human s ettlement, and intensive agriculture are considered as the grass class. To generate the simulation data of land cover changes from the start year to the end year, land cover data of HYDE at the start year and the end year are modified in to five classes that is explained in 2.2.
3) Point based observational data: Point based observational data were collected from the HYDE. Poi nts of human activities such as agriculture, pasture, and human settlements are picked up. These collected point based observational data are the year of 1750, 1800, 1850, 1900, 1950, and 1970 of HYDE.
4) Cultivation intensity Cultivation intensity data are overlaid to represent the impact of agricultural activities. Cultivation intensity data is used to modify the actual vegetation data. In this study, if the pixel has value more than 50% in cultivation intensity data, the class in the representing area in actual vegetation will be modified to intensive agriculture.
5) Total area of agriculture area: Total area of agriculture area is strongly related with the total population. In the interpolation, a restricted condition should be taken into account in which the total agricultural area should be proportional to the total population. However, the computational work can be very heavy if the restricted condition is clearly.taken into account. To avoid this, the interval of the time-slice in the interpolation neighboring time slices which results in an almost constant growth rate of agriculture area expansion between the neighboring time slice. Therefore, knowledge on the land cover changes can be very much simplified.
6) Transitional probability: Knowledge on land cover change is given in terms of transitional probability from one class to another. Transitional probability changes according to regional condition. In areas which are climatologically suitable for high agriculture, the transitional probability from forest or grassland to agriculture areas is relatively high. In areas where the possibility of wind erosion is high, the transitional probability from grassland to barren or desert area is relatively high. In areas with a very high suitability of agriculture, ordinary agricultural areas are likely to change to intensive agriculture area.
- Class category and time interval
In this study, class category is divided in to five land cover classes, forest, grass, APH, IA, barren-l and, and water. APH means Agriculture land / Pasture / Human Settlement, and IA means Intensive Agriculture. This class category is different from the categories used in the input data, “ History Database of the global Environment (HYDE)”. These data should be reclassified to match the new five class category. In this study, result of long term land cover changes is from 1900 to 1990. The time interval of the result is 10 years.
- Three dimensional representation of an individual
(coding)
In this study, a three dimensional array is defined to represent an individual in a space and time domain. The horizontal plane represents two dimensional spaces, and the vertical dimension represents temporal dimension.
- Initialization of population
An initial population for a gene tic algorithm is selected unsystematically. One random trial is made to produce each individual. On the other hand, value of each member of initial population is the same because all members of the initial population are automatically selected by the same procedure.
- Definition and computation of an individual’s fitness
1) Spatio-temporal behavioral models of class variable data In the GA based interpolation, any types of behavioral models can be applied if they can determine the probability of every possible behavior and transition of nominal or class variables. For nominal variable data, possible changes in a class at one pixel are basically defined by the probability of the changes from one class to another. In this study, transitional probability is determined by the combination of classes in the neighborhood. Spatial and temporal relations affected the transitional probability in three ways. The first is spatial continuity which is based on the assumption that the same class data tend to continue in the spatial demotion. The second is temporal continuity which is an extension of the spatial continuity to the temporal domain. The third is expansion contraction relations which is based on the assumption that some data class have a higher possibility of expanding their area at the next time slice while others tend to contract.
2) Definition and computation of fitness of an individual Fitness of an individual is defined by the combination on behavioral fitness and observational fitness. Behavioral fitness is the combined probability of a change in events of nominal variables under the condition that these changes follow a given probabilistic behavioral model or rule. Observational fitness is the combined probability that the observational nominal values occur under probabilistic functions of observational error or uncertainties. Observational probability can be determined by accuracy, resolution and frequency of observation. Overall fitness can be computed by multiplying behavioral fitness and observational fitness. Thus, behavioral or structural models and observational data can be integrated by optimizing the overall fitness.
- Definition of operators
1) Reproduction Reproduction is a process in which individual strings are copied according to their objective function values or the fitness values. Copying strings according to their fitness values means that strings with a higher value have a higher probability of contributing one or more offspring in the next generation. 2) Crossover The crossover operator first randomly mates newly reproduced individuals in the mating pool. It then randomly locates a window of random size for a pair of individuals. Finally, the contents of the individual within the window are swapped to create new individuals. 3) Mutation Mutation is a genetic operator that alters one or more gene values in a chromosome from its initial state. This can result in entirely new gene values being added to the gene pool. Mutation is an important part of the genetic rearch to prevent the population from stagnating at any local optima.
- Improvement of the search
1) Hill-climbing method If the complex space of problem resolutions becomes larger and larger, the population size and the generation size have to be increased bigger and bigger at same time. The efficiency of GA is one of the weak point to real world application of the GA. Hill- climbing is a good method of a search strategy that exploits the best among know possibilities for finding a improved solution. In this study, the potential for combining the Hill-climbing strategy with GA was investigated.
2) Population diversity Premature convergence is caused by early emergence of an individual that is better than the others in the population, although far from optimal. To avoid premature convergence , one has to avoid the loss of population diversity. Although reducing the reproduction number cannot always eliminate premature convergence, it can be used as a simple way to reduce rapid convergence. In this study, the duplicated number of individuals was limited less than two. If the individual’s expected duplicated number is larger that two, it was set equal to two.
Figure 1 shows the result of reconstruction of l ong term , year 1900 to 1990 by 10 years interval, land cover changes by a maximum likelihood i nterpolation method using genetic algorithm. Because long-term changes in climatologic variables are ignored, moreover the number and quality of the point based observational data are limited, the reconstruction results cannot be validated against the other observational data. Nevertheless, the reconstructed results show a reasonable fitting both to the observational data and the knowledge of the changes. It can be concluded that by applying more accurate and reliable scientific data and knowledge of climate changes, long term land use and land cover changes can be reconstructed more accurately.
Conclusion
In this study, the interpolation method is applied to reconstruct long term land cover changes from fragmentary observational data and knowledge of the change. Genetic algorithm and hill climbing can be successfully applied to the combinatorial optimization of nominal voxel-field data. This maximum likelihood interpolation method using genetic algorithm has reconstructed the long term land cover changes by every 10 years interval from year 1900 to 1990. And this reconstructed land cover changes shows a reasonable fitting both to the observational data and the knowledge of the change.
References
- Ryosuke Shibasaki and Shaobo Huang (2000). Integration of observational data and behavioral models for spatio temporal interpolation- application to reconstructing long term land use and land cover changes, Present and Future of Modeling Global Environmental Change Toward Integrated modeling, T. Matsuno and H .Kida, ed. Terra Scientific Publishing Company, Tokyo, 293- 309.
- Klein Goldewijk, K. (2001). Estimating global land use change over the past 300 years: The HYDE database. Global Biogeochemical Cycles 15(2): 417-434.
- Prentice, I.C., Cramer, W., Harrison, S.P., Leemans, R., Monserud, R.A., and Solomon, A.M. (1992). A global biome model based on plant physiology and dominance, soil properties and climate. J. Biogeogr., 19: 117-134.
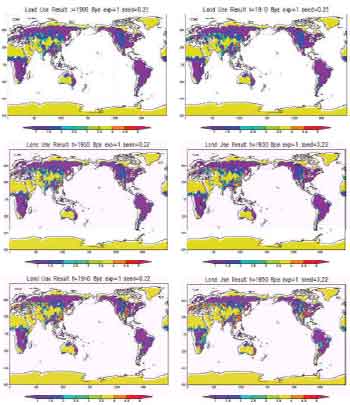

Figure 1. Reconstructed long term global land use and cover change