| GISdevelopment.net ---> AARS ---> ACRS 2002 ---> Land Use/Land Cover |
Monitoring of Landuse using
3S'S, A case study for Palung Sub-Watershed
Raghunath
Jha
Bagmati Integrated Watershed Management Project
GPO BOX:11053, Babarmahal, Kathmandu, Nepal
Tel: (01) 246763
Fax: +977-1-267304
Email: rnjha@biwmp.mos.com.np
Mike D. Hawkes
Bagmati Integrated Watershed Management Project
GPO BOX:11053, Babarmahal, Kathmandu, Nepal
Tel: (01) 246763
Fax: +977-1-267304
Email:rnjha@biwmp.mos.com.np
Basant Rimal
Bagmati Integrated Watershed Management Project
GPO BOX:11053, Babarmahal, Kathmandu, Nepal
Tel: (01) 246763
Fax: +977-1-267304
Email:rnjha@biwmp.mos.com.np
Peter De V. Moss
Bagmati Integrated Watershed Management Project
GPO BOX:11053, Babarmahal, Kathmandu, Nepal
Tel: (01) 246763
Fax: +977-1-267304
Email: rnjha@biwmp.mos.com.np
Bagmati Integrated Watershed Management Project
GPO BOX:11053, Babarmahal, Kathmandu, Nepal
Tel: (01) 246763
Fax: +977-1-267304
Email: rnjha@biwmp.mos.com.np
Mike D. Hawkes
Bagmati Integrated Watershed Management Project
GPO BOX:11053, Babarmahal, Kathmandu, Nepal
Tel: (01) 246763
Fax: +977-1-267304
Email:rnjha@biwmp.mos.com.np
Basant Rimal
Bagmati Integrated Watershed Management Project
GPO BOX:11053, Babarmahal, Kathmandu, Nepal
Tel: (01) 246763
Fax: +977-1-267304
Email:rnjha@biwmp.mos.com.np
Peter De V. Moss
Bagmati Integrated Watershed Management Project
GPO BOX:11053, Babarmahal, Kathmandu, Nepal
Tel: (01) 246763
Fax: +977-1-267304
Email: rnjha@biwmp.mos.com.np
Abstract
GIS, RS and GPS, powerful tools for surveying, mapping and monitoring land cover, were used to monitor landuse changes in Palung Sub-watershed, Makawanpur District, from 1992 to 2001. Using an orthophoto map prepared from 1992 data and an IRS1C Image from 2001, it was found that the area devoted to agriculture decreased by 12.1% in those nine years; it had had been converted to forest. Nearly all shrub land was now forest. Natural forest areas along the agricultural boundaries, however, had declined by 2.5%.
Introduction
Geographical Information Systems (GIS), remote sensing (RS) and the Global Positioning System (GPS) are powerful tools for surveying, mapping and monitoring natural resources. Satellite techniques are useful because their synoptic coverage of large areas renders them cost and time effective. Furthermore, in areas that are difficult to access, RS and GPS are perhaps the only best method of obtaining the required data speedily.
Any GIS comprises four functions--measuring, mapping, monitoring and modeling-- although most organizations in Nepal use GIS for the former two purposes only. The Bagmati Integrated Watershed Management Project (BIWMP), however, used GIS, along with RS and GPS, to monitor the changes in land use in Palung Sub-watershed, Makawanpur District, from year 1992 to 2001. The data required was taken from FINNMAP’s 1992 (orthophotomaps, 1992) and an Indian Remote Sensing Satellite (IRS1C, 2001) geocoded photo. Both are at the same scale, 1:12,500.
Study Area
Palung Watershed lies between 85º 01’30” and 85º 05’33” E longitude and 27º 36’43” and 27º 39’28” N latitude in Makwanpur District, as shown in Figure 1 and 2. The total catchment area of the watershed is 3767ha. The highest and lowest points of the catchment are 2551m and 1660m respectively. This watershed is one of eight sub-watersheds in the Kulekhani reservoir basin. There are three main tributaries of the Palung River in the sub-watershed area, namely, Phedigao Khola, Gharti Khola and Khaiti Khola. The climate of Palung Sub-watershed is warm temperate in the valley and cool temperate on the slopes and in the upper mountain area.
Figure 1. Location map of Palung sub-watershed
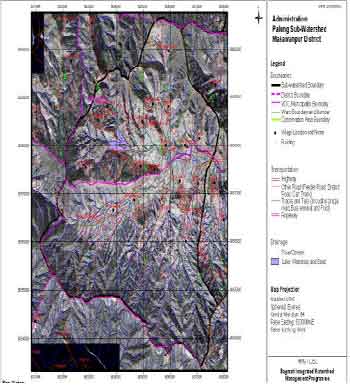
Figure 2. Detail map of Palung sub-watershed
Methodology
Monitoring land use began with a visual interpretation of the 1992 orthophotomap. Land use was classified into three major categories: forest, agriculture and shrub. Since orthophotomaps replicate the ground and show its features clearly, this classification was easily done. Then these three classes of land use were traced on tracing paper and scanned in TIFF format using an A0 scanner. The TIFF image was duly registered in modified universal transverse mercator (MUTM). To reduce error in digitisation, software which converts raster data into vectors was used. After the conversion, polygons of land use were built in Arc/Info. The attributes of the three land-use classes were added to the corresponding polygons of land use.
The IRS1C geocoded photo is gray and topographical features are not clearly identifiable. A visual interpretation was made, assuming that black areas were forests and whitish ones, agricultural land. It is virtually impossible to distinguish shrub land, so only two categories were classified. Agriculture and forestland uses were classified on the map and traced on tracing paper. The above mentioned process is used to covert the traced land-use map to the GIS database.
Once both maps are available in the GIS database, GIS algorithms can be used to reveal the land-use changes which took place between 1992 and 2001. The final land-use map has five categories: forest, agriculture, agriculture changed to forest, forest changed to agriculture and shrub changed to forest. A flowchart of all the steps in this method is presented in Figure 3. Similar concept is used in (Mariamni, 1997) and (Chien 2000).

Figure 3. Flow chart of the Analysis Procedure
Since the land use shown on IRS1C is not as clear as that shown on the orthophotomap, GPS was used to provide intensive field verification. Rangers and villagers were asked to identify land use. Sample plots were decided upon and Differential Global Positioning System (DGPS) was carried out for those plots. After post processing the DGPS for sample plots, the results were plotted on the land-use change map. It was found that the interpretations of land use on most of the plots were correct and the few inaccuracies were adjusted.
Results and Discussion
The total area of the Palung sub-watershed is 2878 ha. The areas under different land uses in year 1992 and year 2001 are shown in Table 1. The area of agriculture land in this catchment decreased nearly 12.1%, from 1157.8 to 1017.3 ha. Similarly, the area covered by forestland increased by 18.1%. The changes in land use from 1992 to 2001 are shown in Table 2. The spatial distributions of these land uses are shown in Figure 4.

Table 2. Land-use changes from year 1992 to 2001
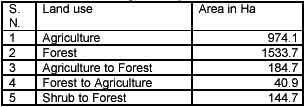
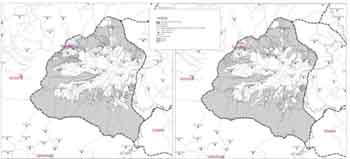
Figure 4. Flow chart of the Analysis Procedure
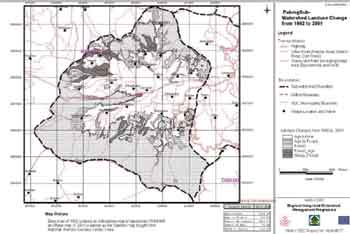
Figure 5. Detail map of Palung sub-watershed
The area in this catchment devoted to agriculture decreased by 12.1% from 1992 to 2001. The main reason is a flood in 1993 which washed away a huge area of farmland. In the course of time, this land became forest. Nearly all shrub land has also been converted to forest through the efforts of the District Soil Conservation Office under FINNIDA and under the community forest programme of the District Forest Office financed by the World Bank. The area of forestland decreased 2.5%. Most of the areas lost border existing agriculture land. From this analysis it can be concluded that the forest situation in this catchment has improved. This is a good indication that watershed management in this catchment has also improved.
Reference
- Orthophotomap, 1992: FINNMAP, Finland has developed orthophotomap of 23 sub-watersheds for BIWMP from Arial photograph taken in year 1992 of 1:50,000 scale by Survey Department. IRS1C, 2001, IRS1C (Indian Remote Sensing Satellite 1C) PAN geocoded photo ( 14 x 14 km ) on 6 Feb 2001 at 10:33. This product was bought from NRSA Data Center, National Remote Sensing Agency, Department of Space, Government of India, Balanagar, Hydrabad-500 0037, email: kaveri_d@Nrsa.gov.In, Phone No. +91-40-3878560, Fax: +91-40-3878158.
- Mariamni Halid , 1997: ACRS1997, Land Use-Cover Change Detection Using Knowledge based approaches: Remote Sensing and GIS,
- Chien-Pin Lee, Stephen S. Young and Hao Chen , 2000: ACRS2000, Land-Cover Change in China using Time Series Analysis, 1982 - 1999