| GISdevelopment.net ---> AARS ---> ACRS 2002 ---> Hazard Mitigation and Disaster Management |
Fire detection technology in
Mongolia
Sanjaa.Tuya
Center for Environmental Remote Sensing of Chiba University
1-33 Yayoi-cho, Inage-ku, Chiba , 263-8522
Tel: (81)-43-290-3845
Fax: (81)-43-290-3857
E-mail: s.tuya@mailcity.com
Japan
Dr. C.P. Gross
Gesellschaft für angewandte Fernerkundung (GAF)
Arnulfstr. 197, D- 80634 München
Tel: (49) 89-12152820
Fax: (49) 89-12152879
E-mail: info@gaf.de
Germany
Yoshiaki Honda
Associate Professor
Center for Environmental Remote Sensing of Chiba University
1-33 Yayoi-cho, Inage-ku, Chiba , 263-8522
Tel: (81)-43-290-3835
Fax: (81)-43-290-3857
E-mail: yhonda@ceres.cr.chiba-ac.jp
Japan
Center for Environmental Remote Sensing of Chiba University
1-33 Yayoi-cho, Inage-ku, Chiba , 263-8522
Tel: (81)-43-290-3845
Fax: (81)-43-290-3857
E-mail: s.tuya@mailcity.com
Japan
Dr. C.P. Gross
Gesellschaft für angewandte Fernerkundung (GAF)
Arnulfstr. 197, D- 80634 München
Tel: (49) 89-12152820
Fax: (49) 89-12152879
E-mail: info@gaf.de
Germany
Yoshiaki Honda
Associate Professor
Center for Environmental Remote Sensing of Chiba University
1-33 Yayoi-cho, Inage-ku, Chiba , 263-8522
Tel: (81)-43-290-3835
Fax: (81)-43-290-3857
E-mail: yhonda@ceres.cr.chiba-ac.jp
Japan
Abstract
The purpose of this paper is to report on the use of satellite based real time fire monitoring system (World Fire Web, WFW) for forest and steppe fire observation in Mongolia. An ability to quickly detect, locate and respond to fires has thus become an important issue for Mongolia. The fire monitoring system is based on using the existing facilities of the Information and Computer Center (ICC) of Ministry for Nature and the Environment to receive daily meteorological satellite imagery (NOAA- AVHRR) which in the thermal infrared sensitive band can detect sources of heat. This new approach is compared with an well proved and operational detecting technology applied by ICC since years.
NOAA /AVHRR Satellite data
Advanced Very High Resolution Radiometer ('AVHRR', Goodrum et al 2000) data from the National Oceanic and Atmospheric Administration ('NOAA') satellites have to date been the most widely used for forest fire detection, providing global imaging of fires and fire scar areas. The AVHRR instrument is a broad -band, four or five channel scanner, sensing in the visible, near-infrared, and thermal infrared portions of the electromagnetic spectrum with a ground resolution is approximately 1.1 km at the satellite nadir. The satellite orbits the Earth 14 times each day from 833 km above its surface with each satellite pass providing a 2400 km wide swath. Nominally, there are two daily passes per day for each satellite, giving a total of 6 passes per day over a given area from the three currently operating satellites (Table 1) In addition to the relatively high temporal coverage and spatial resolution in comparison with other systems, another advantage is the open policy of data transmission provided by the down-link at S-band (1.7 GHz).
| Satellite | Launch Date | Ascending Node | Descending Node | Dates of Service |
| NOAA-12 | 14/05/91 | 19:30 | 07:30 | 14/05/91- Present |
| NOAA-14 | 30/12/94 | 13:40 | 01:40 | 30/12/94- Present |
Originally intended only as a meteorological satellite system, the AVHRR instrument remotely senses cloud cover and sea surface temperature, enabling its visible and infrared detectors to observe trends in vegetation, clouds, shore-lines, lakes, snow and ice. The visible and near infrared bands (channels 1 and 2) can detect smoke plumes from fires and also fire scars. The middle infrared band (channel 3) can detect active fires. The ability to detect fires is greater at night, when there is less likelihood of confusing active fires with heated ground surfaces. Saturation occurs at around 323 K in the middle infrared channel.
Since 1987 the ICC daily receives the AVHRR data from NOAA meteorological satellite. The Quorum HRPT receiving station can receive data from two polar orbiting meteorological satellite by using QTRACK software on PC at a time. NOAA data is then stored as digital HRPT data on VAX- II automatically by HRPT_AUTO software. The HRPT data stream includes data from all sensors aboard the NOAA satellites. Channels 2 (near infrared), 3 (middle IR) and 5 (thermal IR) from AVHRR sensor are extracted from the HRPT data stream for the detection of fires. Images of the size 1024 rows by 1024 columns are transferred to the forest and steppe fire detection. As the approximate time for one orbit is 100 min, the present receiving system QTRACK obtains data sets a day.
The Methodology of fire detection
1. Fire detection methodology in practice at ICC
Using the image processing system IVAS, IDRISI, PCI the ICC created a methodology to detect fire sources and burnt area, and estimated the threshold values. Most important information source is channel 3 of NOAA/AVHRR.. This channel is very sensitive to the high temperature target on the ground and can be used to detect active fire with the following algorithm:
I. Active fire:
a) CH3 > 45°C
b) CH1(or CH2) = 6 - 12
As channel 1 and channel 2 are sensitive to the vegetation, waterbody and clouds, these 2 channels have the ability to detect burnt area and smoke plums.
II. Burnt area:
a) CH3 > 35 - 45°C
b) CH1(or CH2) = 3 - 6
Channel 4 or 5 are used for cloud masking.
This data processing including a simple geo-referencing can be carried out very quickly. In the final image product, active fires are identified by visual interpretation and plausibility check. By above mentioned methodology using the daily NOAA satellite data we can monitor and produced daily fire maps and hot spots , as showed on Figures 1 have been illustrated the trends of steppe fire over Dornod and Khentii aimags (North Eastern part of Mongolia).
2. Fire detection methodology using NOAA/AVHRR data in JRC
Since 1998, the Joint Research Centre of the European Community in Ispra (Italy) developed a global fire monitoring system. It is being developed in response to a call from scientists and policy makers for globally consistent information on the distribution and behaviour of fire in the environment Satellite images (NOAA AVHRR) are acquired by a world- wide network of receiving stations. Each station operates a data processing chain for detecting fires in the satellite imagery. The data is processed immediately on-site at the receiving station. The thematic product, in this case co-ordinates of detected fires, is much reduced in volume compared to the original satellite images, so it can reasonably be transmitted over internet links between receiving stations. Daily, global fire maps are built up at the JRC in Italy from this regional data by automatically sharing regional fire maps over the internet. Global fire information is then available on-line, in near real-time (Figure 2)
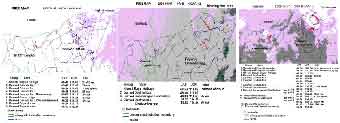
Figure 1: Steppe fire in April 2000, Northern Mongolia.In 2000, a regional World Fire Web (WFW) node was set up in Mongolia at the ICC in the framework of a
The local WFW nodes might directly respond to the information “coordinates of active fires”. In any case they have the ability to transfer the data to GIS systems for more detailed evaluations or preparing cartographic outputs.
Figure 2: WFW Fire map showing active fires in Mongolia
TACIS Project founded by the European Commission. Since then the processing chain is operational and used for the fire detection in Mongolia.
3. Fire detection algorithm of WFW
In contrary to teh fire detection method developed at ICC, the WFW used a contextual algorithm. Such an algorithm can be applied to a global data set without having to be adjusted for different geographical regions. The algorithm chosen is based on work by Prins and Menzel (1992), Flasse and Ceccato (1996), and reported in Justice and Dowty (1993).
There are two phases:
- Threshold Fire Test - a selection of pixels that could potentially contain fires, and thus be called "fire pixels".
- Contextual Fire Test - a confirmation of the fire pixel classification by comparing the pixel with its immediate neighbourhood.
- Threshold Fire Test: This phase is intended to select all those pixels that may contain a fire. It uses thresholds that are low enough to keep any possible fire, but high enough to reject most background pixels. A pixel is selected as a potential fire if: Tb(3) > 311K and Tb(3) - Tb(4) > 8K
- Contextual Fire Test: This second phase confirms whether or not the
fire detected in test (1) is definitely a fire. The test is based on
knowledge of the candidate pixel in relation to its neighbours. Firstly,
in order to reject pixels whose radiance in Ch(3) is influenced too much
by high reflection, the following test is used:
Ch(2; Top of Atmosphere) < 20%
Secondly, statistical information is calculated about the pixels in a surrounding "background" contextual window. Any surrounding pixels found to be cloud, potential fires, water, desert or affected by sun- glint, are excluded from the calculation. Starting from a size of 3 × 3, the window is allowed to grow until at least 25% of the pixels contained qualify to be included in the calculation of the statistics. If there are still not enough valid pixels when the window has grown to 15 × 15, then the algorithm is unable to make a decision and the possible- fire pixel is recorded as "indeterminate" - a so-called "blue-point". Once a valid context window has been built, the following are calculated:
s(3)bg = Standard deviation of T b(3) in the background.
Tb(34)bg = Mean value of [T b(3) - Tb(4)] of pixels in the background.
s(34) bg = Standard deviation of [Tb(3) - Tb(4)] of pixels in the background.
A potential fire is then confirmed if:
[Tb(3) - Tb(4)] > Tb(34)bg + 2 s(34)bg and Tb(3) > Tb(3)bg + 2 s(3)bg + 3K.
Results
Since spring 2000, the new processing chain for fire detection is operational at the ICC. In the first fire season, 264 fires were detected primarily by satellite data and thus millions of money was saved. Comparing the new approach with the traditional method of fire monitoring at the ICC it can be concluded:
- Once set up, the new processing chain can detect fires and burnt area automatically without remarkable input of manpower.
- In contrary to the traditional method, the WFW system directly locates the position (geographic co-ordinates) of active fires. However, maintenance of the hard- and software has to be guaranteed..þ The WFW approach is able to cover large areas (e.g. entire NOAA scene), where as the traditional method concentrates on specific regions of interests. More, the WFW shares this information with all interested people in the world.
- Fire maps produced by WFW software have been compared with locally produced fire maps, including ground truth data of the Aimag centers. The results are highly correlated with the fire detection based on the local method.
- To a small extend, both methodologies produce errors due to different reasons: the traditional method confuses active fires with very hot land surfaces or reflected sunlight (water bodies), the WFW software shows more problems along the limits between hot and cold land surfaces (e.g. forest – steppe).
- The major disadvantage of the WFW system compared to the local method is, that real time observation is not possible. Necessary ephemeris data for the fire processing is available at the earliest one day after the image reception.
The monitoring methodology gives details on burnt areas for the environmental assessments of damage. In the 2000 year, a totally 4,946,99 thousand ha pasture and forest was burnt. Total cost of property 502,1 million MN¥ (Mongolian Tugrig). Figures 4 shows the total burned area of fire over Mongolia during the fire season of 2000.
Figure 3. Fire frequency map of Mongolia for the period of March-May 2000
Figure 4. Burnt area maps of Mongolia for the year 2000.
Conclusion
Fire monitoring in Mo ngolia is essential for all kind of land-use planning and forest management. To detect and monitor wildfires and to support fire management activities with real time information on fire events is of high priority. To meet this objective, a fire detection methodology based an NOAA AVHRR data has been developed at the ICC. To improve the fire monitoring, a second processing chain was set up using the WFW software in 2000. This new software allows also to estimated burnt area and it can be run daily in the “background” without permanent intervention of staff. A large data base can be achieved over the entire fire season for further evaluations and research activities. However, for the real time information in specific regions e.g. to alert and move fire brigades, the traditional method is still in practice.
Reference
- N. Erdenesaikhan, M Erdenetuya: Forest and Steppe Fire Monitoring in Mongolia Using Satellite Remote Sensing IFFN No. 21 - September 1999, 71-74 pp
- Narangerel. 1997. Some factors of forest fires in temperate forest conditions. Ulaanbaatar, Mongolia. Unpublished.
- Tsedendash, G. 1991. Forest Features of Mongolia. Ulaanbaatar, Mongolia. Unpublished report.
- Valendik,E.N., G.A.Ivanova, Z.O.Chuluunbator, and J.G.Goldammer. 1998. Fire in Forest Ecosystems of Mongolia. Int. Forest Fire News No. 19, 58-63.