| GISdevelopment.net ---> AARS ---> ACRS 2002 ---> Hazard Mitigation and Disaster Management |
Visible and NIR reflectance
spectra of the components of a LANDSLIDE zone in the Nilgiris, South
India
S. Jayaseelan
Centre for geoscience and engineering
Anna University, Madras-600 025 India
Email: mailto:ssanjeevi@%20annauniv.edu
S. Sanjeevi
Centre for geoscience and engineering,
Anna University, Madras-600 025 India
Email: mailto:ssanjeevi@%20annauniv.edu
Centre for geoscience and engineering
Anna University, Madras-600 025 India
Email: mailto:ssanjeevi@%20annauniv.edu
S. Sanjeevi
Centre for geoscience and engineering,
Anna University, Madras-600 025 India
Email: mailto:ssanjeevi@%20annauniv.edu
Abstract
Landslides can occur without any prior indications, thereby causing considerable damage to human beings, vegetation and landscape. Such unpredictability demands development of tools and techniques to study the landslides in detail. Landslides and landslide-prone areas can be identified better, and in a faster manner using remote sensing techniques. The majority of the methods, however, have been the interpretation of aerial photographs and satellite image. This discussion paper is concerned with the assessment of remote sensing techniques to map the components of a landslide zone in the Nilgiris south India. Marappalam landslide zone is selected for this study using satellite images and for studying the reflectance characteristics of the components namely, the slide zone, rock outcrops, soil cover, vegetation, sapprolite/ lithomarge etc. These are studied in the visible and near - infrared regions (0.4µm to 1.1µm) of the Electro Magnetic Spectrum (EMS).
Analysis of multi temporal satellite image (SPOT 1 - MLA and IRS 1B - LISS2) is done to identify and delineate the Marappalam landslide. The post slide satellite image reveals that the slide is located at the intersection of two conspicuous lineaments. As regards the reflectance spectra, it is observed that the younger landslides have higher reflectance in the visible and near-infrared regions. Low NDVI (Normalised Difference Vegetation Index) values are indicative of landslide patches, slide-prone areas or outcrops, thus suggesting the usefulness of NDVI in the study of landslides. Thus spectral sensing and multitemporal image interpretation techniques may form an effective basis for the study of landslides and efficient disaster management.
Intorduction
This paper is concerned with the study of the spectral reflectance characterstics of the components of a landslide zone in the Nilgiris, south India. This study would form the basis for understanding the exact nature and manifestation of landslides and landslide-prone areas in.multispectral image data. This study assumes significance in the present context of an increasing risk of landslide occurrence, which demands the use of versatile tools such as remote sensing to mitigate the hazards.
Aims and Objectives
- To evaluate the applicability of spectral remote sensing in landslide studies,
- To understand spectral behavior of stable and unstable slopes in order to identify them in satellite image data,
- To relate the spectral properties of the components of the landslide zone to their image characters,
- To understand the relationship between the percentage cover of land-cover features in a landslide zone and the spectral signature in satellite images, and
- To identify optimal spectral technique that could be used to delineate landslides, stable and unstable slopes.
Occurrences of landslides are common in Nilgiri district, particularly during the north-east monsoon. During 1993, about 408 landslides were reported to have occurred of which Marappalam (Fig.1) is the severest one in terms of magnitude. This slide occurred 26 km away from Mettupalayam town on the state highway.
Fig. 1. Location map of Nilgiris
Since the Marappalam area and its surrounding area has experienced such landslide time and again, it was decided to select this area for the present study. Physiography, Geology and Geomorphology of study area The general elevation of the study area varies from 1,100 m to 1,600 m above msl. The Coonoor peak is the highest one at 2091 m above MSL. The Coonoor stream, which drains the area has a straight to sinuous course. Two erosional surfaces, at altitudes of 2,400m and 2,100m were, reported by Parthasaradhi (1974). The rocks exposed at the slide area are garnetiferous, quatrzofelspathic gneiss and pyroxene granulite with EW foliation trend, dipping steeply towards south to vertical. The trend of foliation is sub-parallel to the slope.
Marapplam slide
A massive slide occurred at Marappalam on 11th November 1993, between 12:00 and 13:00 hrs on state highway no. 8 - on Mettupalayam - Ooty highway. The area experienced a torrential down pour of 282 mm in the previous day. First signs of material movement was reported to have occurred around 0600 hrs on 11th November. The slide occurred in a densely wooded area considered safe between elevation 1600m and 1100 m above msl. The slope above the crown is occupied by rock escarpment and tea gardens further above. The slope forming material comprises.colluvium/sapprolite with a thin veneer of soil. The depth to bed rock is of the order of 3m (Balachandran et.al 1995 ) The slide had taken place in slope forming material, predominantly soil mixed with boulders and sapprolite, on a slope of 30 0 . The triggering mechanism is inferred as water charging the interface of bedrock and soil and consequential increase in pore pressure due to the torrential down pour the area experienced the previous day. This initiated subsidence and earth flow was in the direction of S 20 o E in the crown portion.
Methodology
- Preparation of basemap and maps showing geological, geomorphological, vegetational, drainage, soil and all other landcover components of the landslide area using remote sensing images and existing literature of Marappalam.
- Spectro-radiometric studies (in the visible and NIR regions) of the above components.
- Analysis of the relationship between the observed spectral data and the components.
To have a preliminary idea about geo-environmental conditions that prevailed in and around Marappalam, before and after the occurrence of the November 1993 landslide, it was proposed to study the pre- and post- landslide satellite imagery which are as follows:-
| Satellite / Sensors | Date of acquisition Scale | Path-row-ID | |
| Spot I HRV MLA | 22.11.89 | 11370-053558 | 1:50,000 |
| IRS IB LISS II | 11.3.94 | 26-60-L2B2 | 1: 50,000 |
First, based on the previous knowledge of the area, spectral range of the image data used and type of land cover features, an image interpretation key was developed for the image and the theme. Based on the above key, the pre- and post- landslide images were interpreted (Fig.2 & 3). The resulting maps showed the various categories of vegetation density in the area. It is presumed that sparse vegetation areas are indicative of the possible zones of landslides if there is a thick overburden of sapprolite / lithomarge / colluvium and the location is either along the lineament or at the intersection of two or more lineaments.
Fig.2. Vegetation density map of Coonoor and its environs during Novermber 1989
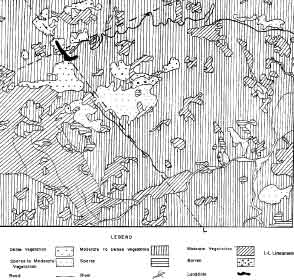
Fig.3. Vegetation density map of Coonoor and its environs during March 1994
It is observed that the aerial extent of sparsely vegetated and barren regions has increased between 1989 and 1994 due to deforestation. Such deforestation activity has been attributed to the 1993 landslides of Marappalam. In the post-slide (1994) image, the Marappalam landslide is seen as a bright elongated patch amidst dense vegetation. Closer examination of the terrain reveals that this landslide is located exactly at the intersection of two conspicuous lineaments (Fig.3). One of these lineaments trends in the NNW-SSE direction while the other trends in the ENE-WSW direction. These two lineaments were identified on the IRS 1B LISS II FCC based on their image characters, such as linear shape, alignment of vegetation and presence of a straight stream course..These lineaments occur on the charnockites and are probably old enough to result in an appreciable horizon of weathered material. The location of the intersection of these two fractures is a zone of highly weathered, brecciated, altered and crushed material. This material was washed down due to the action of percolating water and gravity, to result in the slide. The slide, depicted in the IRS-1B image has a linear shape and this aligned and located on NNW-SSE lineament.
Reflectance characteristics of the components of the landslide zone
This section describes the reflectance spectra of various components such as soil, vegetation, outcrop, weathered material/lithomarge and a mixture of these components found in the Marappalam landslide zone. The spectral range of the measurement of reflectance is between 0.4µm to 1.1µm. The area is characterized by the presence of medium to high slopes, tea plantation, medium to dense forest, deforested patches, barren outcrops, thick overburden of weathered mass, layer of soil and sapprolite / lithomarge.
To identify the landslide prone areas and palaeo-landslide zones using remote sensing techniques, it is essential that one is fully aware of the reflectance characteristics of all the components mentioned above. Hence, using the Ground Truth Radiometer, attempt has been made to record reflectance of light from these components present in the Marappalam area. Fresh, exposed bare soil/lithomarge found in younger and fresh landslides are in general brighter compared to old and non-landslide areas. This is because drainage and vegetation are not established in the early stage. Accordingly, the reflectance curve of a fresh landslide area is characterised by higher values in all the wavelength regions up to 1.1µm. Reflectance increases with increasing wavelength as seen in figure 4. The brighter soil and clayey materials along with freshly exposed rock surface reflect a considerable amount of incident light energy. It is also observed that an increase in the amount of soil-cover results in a proportional increase of reflectance in the Visible and Near infra red regions (Fig.4). Such a phenomenon may be made use of in identifying fresh landslide areas in contrast to older landslides.
Areas that have experienced landslides few months or a year ago develop vegetation cover depending on the slope, thickness of weathered mass, available moisture and frequency of occurrence of landslide in the same area. Densely vegetated areas, even if characterized by higher slopes, are indicative of stable, landslide free zones. The reflectance spectra of such an area is depicted in figure 4 (curve 6). It is seen that the visible (green) and NIR reflectance are quite high for such stable areas covered with vegetation. The typical absorption at 0.7µm, the peak reflectance at 0.8µm and the typical shoulder between 0.8µm and 1.1µm is observed for such areas. The presence of dense vegetation along the landslide zone restricts the contribution to reflectance from the bright soil. The quantum of such contribution, however, is dependent on the type of species, the Leaf Area Index (LAI), canopy diameter and other biophysical parameters (Elvidge and Lyon,1985 ).
Figure 4. Spectral reflectance of the salient components of landslide zone in the Nilgiris.
Fig. 5. NDVI for the sample locations in a Landslide zone in the Nilgiris.
Wherever fresh rock, without any weathered overburden or vegetation, is encountered, it is characterized by the reflectance curve of silica and feldspar rich rock, namely Charnockite. Certain.areas of the landslide zone are composed of dry and decaying vegetation which could alter the Digital Number of the satellite data. Hence we should understand the spectral behavior of dry biomass and its contribution to the composite reflectance of a landslide zone. Low reflectance (<10%) in the blue and green bands and moderate reflectance (10% - 20%) in the red and near IR bands, is exhibited by the landslide zone with dry biomass (curve 3 of Figure 4). To understand the relationship between the combination of the various components and the composite reflectance, the percentage cover of four principal components of the terrain, namely, soil, rock outcrops, dry vegetation and green vegetation were computed for the locations where the reflectance was measured. Table 1 shows the percentage cover of these components measured at the various locations. It is seen from the table that large amount of vegetation results in higher reflectance in the NIR region (Band 4). This is especially true for location 3.
| Location | % of Soil | % of Rock/outcrops | % of dry Vegetation | % of Green Vegetation | % Reflectance | ||||
| Blue band 0.4-0.5 µm | Green Band 0.5-0.6µm | Red Band 0.7-0.8µm | NIR Band 0.8-1.1µm | NDVI | |||||
| 1 | 67.81 | 19.19 | 9.00 | 4.00 | 7.46 | 12.93 | 10.52 | 29.20 | 0.4716 |
| 2 | - | 82.04 | 12.74 | 5.22 | 25.31 | 21.39 | 27.02 | 30.89 | 0.0700 |
| 3 | 56.55 | 15.35 | 11.76 | 16.33 | 7.05 | 9.40 | 11.83 | 60.00 | 0.6700 |
| 4 | 25.49 | 74.05 | 0.45 | - | 40.38 | 36.31 | 52.78 | 66.66 | 0.1162 |
| 5 | 96.60 | 2.61 | 0.78 | - | 8.42 | 16.22 | 25.39 | 30.26 | 0.1488 |
| 6 | 84.64 | 0.98 | 14.37 | - | 7.86 | 10.08 | 16.40 | 25.87 | 0.2242 |
| 7 | 76.60 | - | 22.87 | 0.52 | 11.23 | 14.47 | 20.63 | 37.06 | 0.2849 |
| 8 | 48.35 | 49 | 0.66 | 1.98 | 33.35 | 28.85 | 37.83 | 73.71 | 0.3183 |
Landslide vegetation and the vegetation indices
In the field of remote sensing applications scientists have developed vegetation indices for qualitatively and quantitatively evaluating vegetative covers using spectral measurements. The use of the red and NIR channels of the sensors on board satellites are particularly well suited to study vegetation. The different combinations between these channels, called vegetation indices, are quantitative measurements indicating the vigor of vegetation. The interest of these indices lies in their usefulness in the interpretation of remote sensing images mainly for the evaluation of the vegetative cover density (Bannari et.al. 1995 ).
Normalized difference vegetation Index (NDVI) is one such index and is expressed as:
NDVI = (NIR-RED) / (NIR+RED)
The index in sensitive to the presence of green vegetation and it permits the prediction of agricultural crops and precipitation in semi arid areas.
Vegetation index for the Marappalam landslide zone
The logic that vegetation cover is an important contributory factor to the occurrence of landslide forms the basis of the present study. The argument in this study is based on the Marappalam experience that barren (non vegetated) exposures are the main entry points for rainwater to infiltrate causing landslides.
It is observed that fresh landslide areas that have exposed the bright soil cover, have very low (~0.15) NDVI thus indicating the complete absence of vegetable in a fresh landslide. Areas dominated by rock outcrops are characterised by very low (~0.06) NDVI. Moderate presence of vegetation in landslide and non-landslide area results in moderate NDVI values (~0.35). Densely vegetated areas (including tea gardens) have higher NDVI values even if they are present in stable slopes.
The relationship between the NDVI values and the percentage of cover of soil + rock and percentage cover of green vegetation indicates that there exists a positive a linear relationship between the percentage cover of green vegetation and NDVI values. Whereas, a negative linear.relationship exists between the percentage cover of soil + rock and the NDVI values. Sparse to medium density vegetation leads to low to intermediate values, whereas totally barren landslides patches have the least NDVI values. Such a clear contrast in the NDVI signatures certainly helps in identifying landslide patches and landslide prone areas.
This method of using NDVI as an indicator of landslide prone area may be adopted in identifying landslide zones. After preparation of an NDVI image, it can be overlain on the slope, lineament and drainage maps to demarcate area susceptible to landslides. Thus NDVI maps can also be as useful layers in a GIS applicable to landslide studies.
Conclusion
This discussion paper has demonstrated the usefulness of remote sensing for studying landslide zones to understand landslides better. Analysis of the visible and near infrared reflectance of the components of the Marappalam landslide zone has shown that it is possible do delineate landslide zones including stable and unstable slopes. Vegetation indices also provide satisfactory information about the landslide zone.
This paper has also demonstrated that multi temporal satellite images are useful in monitoring landslides and in understanding the causes and origin of the landslides. The pre- and post- landslide images present us with great details about the nature, origin and causes of landslides. Fresh and younger landslides have higher reflectance in the visible and near-infrared regions due to the absence of vegetation and the presence of rock outcrops, sapprolite and lithomarge. Stabilized slopes have higher reflectance in the near-infrared regions due to the presence of dense vegetation.
Since NDVI is an indicator of vegetation density (and hence stable slopes), the same has been computed for different locations in the field. It is observed that low NDVI values indicate landslides or outcrops, thus suggesting the usefulness of NDVI in the study of landslides.
References
- Balanchandran, V., Thangavelu, C. and Pitchaimuthu, R. 1995, Marappalam landslide, the Nilgiri District, Tamil Nadu, India - A case study. Proc. of the International conference Disaster Mitigation, Vol. I, Earthquake and Landslides, Anna University Chennai, India.
- Bannari, A., Morin, D., Bonn, F. and Huete, A.R., 1995. A review of Vegetation Indices. Remote sensing reviews, Vol. 13, pp.95- 120.
- Elvidge, C.D., and Lyon.R.J.P., 1985. Influence of Rock-Soil, Spectral variation on the Assessment of Green Biomass. Remote sensing of Environment, Vol.17. pp. 265-279..4. Parthasaradhi, Y.J. and Vaidhayanathan, R. 1974. Evolution of landforms over the Nilgiri, South India. Journal of the Geological Society of India. Vol. 15, No.2, pp. 182-188.