| GISdevelopment.net ---> AARS ---> ACRS 2002 ---> Hyperspectral Data Acquisition and System |
Computation of Atmospheric
Water Vapour Map from MODIS Data for Cloud-free Pixels
Agnes Lim
E-mail: crslima@nus.edu.sg
Chew Wai Chang
E-mail: crsccw@nus.edu.sg
Soo Chin Liew
E-mail: crslsc@nus.edu.sg
Leong Keong Kwoh
E-mail: crsklk@nus.edu.sg
Centre for Remote Imaging, Sensing and Processing (CRISP)
National University of Singapore
Blk SOC, Lower Kent Ridge Road, Singapore 119260
Tel: (65) 8744411 Fax: (65) 7757717
Singapore
Abstract:
Water vapour is a highly variable constituent in the atmosphere. From the visible region to thermal region of the electromagnetic spectrum, it is one of the culprits hindering the measurement of actual radiance and reflectance from the surface. Water vapour maps can be generated from MODIS data by measuring the relative transmission for a suitably chosen water vapour absorption band and two “window” bands where water absorption is negligible. With the transmittance map, a binary search is performed using lookup tables generated using MODTRAN to retrieve the total precipitable water, giving a water vapour map. With this map, data can be corrected for atmospheric water vapour absorption effect.
1. Introduction
The Moderate Resolution Imaging Spectrometer (MODIS) onboard Terra satellite views the earth every 1 to 2 days. It is thus well suited for global monitoring of atmospheric properties from space. Moreover, it acquires data in 36 spectral bands and hence allowing for multidisciplinary studies of earth-atmosphere and ocean -atmosphere studies. Five near infrared (NIR) bands are useful to the remote sensing of water vapour, making it possible to derive total columnar water vapour from MODIS data at a spatial resolution of 1km. By taking the ratio of 1 absorbing infrared band to the weighted average of 2 non-absorbing bands, the two way transmission through the atmosphere can be derived and used for remote sensing of total columnar water vapour
The ability to obtained information on the distribution of precipitable water vapour will improve the understanding of the hydrological cycle, biosphere-atmosphere interaction, the energy budget and monitoring climate change due to greenhouse gases. Besides their utilization in atmospheric correction of remote sensing imagery, the water vapour distribution maps generated at different dates also enable multi-temporal monitoring of atmospheric moisture, which can be an indication of drought conditions in the region.
2. Algorithm
Remote sensing of water vapour is based on detecting absorption by water vapour of the reflected solar radiation after it was transferred down to the surface and back up through the atmosphere. The total vertical amount of water vapour can be derived from a comparison between the reflected solar radiation to the absorption channel and the reflected radiation in the nearby non-absorption channels. [1] The solar radiation between 0.86 and 1.24mm on the Sun-surface-sensor path is subjected to atmospheric water vapour absorption, atmospheric aerosol scattering and surface reflection. Rayleigh scattering near the 1 mm region is negligible and the aerosol concentration is assumed to be low so that there is no need to model the single and multiple scattering in the derivation of column water vapour amounts.
Different surfaces have different reflectance values for a given wavelength; hence it is not possible to retrieved water vapour transmittance using just the radiance of one single band. Ratios of absorption channels to atmospheric water bands are used. The approximated atmospheric water vapour transmittance can be derived by taking ratios, and the effects of variation of surface reflectance will be partially removed. If the surface reflectance does not vary with wavelength, a 2-band ratio is sufficient to obtain the water vapour transmittance. For example, if the transmittance of MOD IS band 19 at 0.94µm is required then transmittance can be obtained by using equation (1).
where r* is the apparent reflectance.
Most land surface is covered by soils, rocks , vegetation, snow or ice. The reflectance of most land surfaces is not constant. Hence, equation (1) is generally not applicable. Figure 1 shows the typical reflectance curves of five major types of soils. The reflectances between 0.85 and 1.25mm change approximately linearly with wavelength. The largestdeviation from linearity is observed in the reflectance spectra of iron rich minerals and soils. These materials have broad electronic bands which are related to Fe 3+ transitions and are centred near the 0.86µm. Curve 3 in figure 1 shows such abroad band[1].
Figure 1 Typical Soil reflectance curves for live major soil types [1]
The reflectance of many land surfaces can be approximated by a linear variation with respect to the wavelength. In this case, if is an absorption bands and are two adjacent windows, then it can be shown that the transmission at the absorption band can be expressed as
MODIS bands No. 2, 5, 17, 18 and 19 centred at 0.865., 1.24, 0.905, 0.936 and 0.940mm respectively are used in the retrieval of total columnar water (Table 1). Among the absorption bands, Band 19 is usually used to retrieved water vapour transmittance when water vapour content is high (several cm precipitable water), wheras band 18 is more sensitive when the water vapour content is low [5].
Table 1 Position and Bandwidths of the MODIS IR channels used in water vapour retrievals
| MODIS Channel# | Position (mm) | Bandwidth (mm) | Characteristics |
| 2 | 0.865 | 0.040 | Window |
| 5 | 1.240 | 0.020 | Window |
| 17 | 0.905 | 0.030 | Absorption band |
| 18 | 0.936 | 0.010 | Absorption band |
| 19 | 0.940 | 0.050 | Absorption band |
Before the water vapour map can be obtained from the data, a set of lookup tables (LUTs) has to be generated. For the purpose of retrieving the total columnar precipitable water, the LUTs used in this study were generated by computing the atmospheric transmission at the MODIS water vapour absorption band (band 19) for various sensor viewing angles and solar zenity angles, and for several values of the total precipitable water (W), using the MODTRAN radiative transfer code. LUTs were also similarly generated for all other MODIS bands for the purpose of performing water vapour absorption correction on these bands.
The measurement data obtained by the network of aerological stations show that the vertical distribution of the mean humidity in the troposphere can be describe satisfactorily using a simple exponential formula, in spite of a significant divergence between individual profiles [2]. Moreover, the scale height of water vapour in the atmosphere is between 2 to 3 km [3]. The standard tropical atmospheric water vapour profile used in MODTRAN can be fitted to equation (3).
The density of water vapour in equati on (3) at each height is in units of parts per million volumes. It was converted to g/m3 before W is obtained by integrating over the height z,
During the computation of LUTs, different amounts of W were obtained through multiplying a constant factor to the standard tropical profile and replacing the water vapour density with saturated water vapour density whenever the computed density exceeded the saturation density. Water vapour density profiles were also generated using the various precipitable water vapour values and then input into MODTRAN to compute the transmittance for various angles and wavelengths up to a height of 10km. At 8 to 9km height, the water vapour density is considered negligibly low. In this way, the LUTs of all 36 MODIS bands, in steps of 0.1° for q and 0.001cm for W were generated.
For the purpose of generating the water vapour map, transmittance at the water vapour absorption bands (band 19) of a MODIS image was calculated for every cloud free pixel using equation (2), giving a transmittance map. Given the transmittance at each pixel, the total precipitable water W can be retrieved from the LUT for band 19 through a binary search algorithm.
3. Results
A set of MODIS data was used to test the algorithm. The data was acquired on 14 September 2002. The true colour image is shown in Figure 2A. Figure 2B is the cloudmask [4] for the image. Figure 2B is a binary image where the black pixels are the cloudy pixels that have been masked out while the white pixels are cloud-free pixels. Figure 2C is the water vapour map for the data set generated using the algorithm described previously. Together with the cloudmask, if a cloud pixel, is detected water vapour retrieval is not performed and a value of 7.0 to denote that is a cloud pixel is been assigned. Bad data or missing data pixels were given a value of 8.0. From the distribution of water vapour shown in the map, the atmosphere above the land area appears to have a higher water vapour content compared to that over the sea.
From the water vapour map, the water vapour content over the region is rather low. The dataset is acquired at a time where there are many forest fires and the low water vapour content implies that the region is dry and thus is conducive to fires.
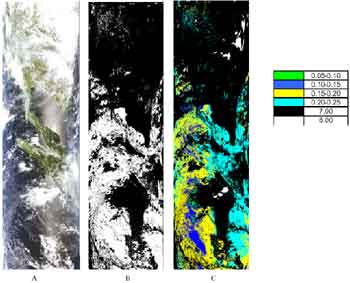
Figure 2 (A) True colour image of the test data set (B) Cloudmask for the test data set. (C) Retrieved Water Vapour Map for the test data set.
4. Conclusion
Once the precipitable water for every pixel has been retrieved, transmittance at any other bands for the same data set can be retrieved using the respective LUTs. Atmospheric water vapour absorption correction can be performed on a pixel by pixel basis to remove the effects of water vapour absorption, which is the main reason for the reduced radiance detected by the sensor in the thermal region. The corrected data can then be used for other studies.
The next step to proceed is to derive the total precipitable water vapour for cloud pixel, in order to generate a complete water vapour map for each pass.
Reference
- Bo-Cai Gao and Yoram J. Kaufman, “The MODIS Near IR Water Vapor Algorithm”, Algorithm Technical Background Document, 1999
- V.E. Zoev and V.S. Komarov , 1987, “Statistical Models of the Temperature and Gaseous Components of the Atmosphere”, D. Reidel Publishing Company, The Netherlands, pp 13
- Robert Frouin, Pierre-Yves Deschamps and Pierre Lecomte , “Determination from Spa ce of Atmospheric Total Water Vapour Amounts by Differential Absorption near 940nm :Theory and