| GISdevelopment.net ---> AARS ---> ACRS 2002 ---> Ecology, Environment & Carbon Cycle |
A Study on Land Use and
Environment in Tonza City area in Hainan Province, China: Twenty Years of
Change
Krishna Pahari
Department of Human Ecology, School of International Health, University of Tokyo
7-3-1, Hongo, Bunkyo-ku, Tokyo 113-0033, Japan
Tel: (81)-3-5841-3608, Fax: (81)-3-5841-3395
E-mail: pahari@humeco.m.u-tokyo.ac.jp
Masahiro UmezakiI
Section of International Health, Graduate School of Tokyo Medical and Dental University
1-5-45 Yushima, Bunkyo -ku, Tokyo 113-8519
Tel: (81)-3-5803-5188, Fax: (81)-3-3818-7176
Hong Wei Jiang
Department of Human Ecology, School of International Health, University of Tokyo
7-3-1, Hongo, Bunkyo -ku, Tokyo 113-0033, Japan
Tel: (81)-3-5841-3608, Fax: (81)-3-5841-3395
E-mail: pahari@humeco.m.u-tokyo.ac.jp
Abstract:
Counties under the Tonza city of Hainan province in China are remote areas inhabited mainly by Li ethnic community. Remote Sensing has been utilized in order to better understand the human interaction with the environment and the natural resources. This paper summarizes the study of changing land use covering a time span of last two decades, in the four counties, namely Fan Yang Zheng, Maoyan Zheng, Hongshang Xiang and Shui Man Xiang in Tonza city area in Hainan. Landsat MSS and Landsat ETM data were used to analyze the land cover into broad classes, and then spatial and temporal dynamics of land use change was analyzed for the whole area and different counties. The study showed a significant increase in forest and a decrease in grassland in the study area over this period. This change is consistent with the history of various policy measures and laws with respect to shifting cultivation and forest use adopted in the area during the period, which could be verified from our field investigations.
1. Introduction and the Study Area
The Tonza area in Hainan province of China is inhabited by minority nationality called Li ethnic community. It is in the remote mountainous region in the inland of Hainan island. Most of the inhabitants are farmers and their socioeconomic condition is very poor compared to the people in the coastal areas. They have traditionally been following their lifestyle based on subsistence farming. However, there have been marked change in the way they have been using their land and resources over the last several decades.
There have been two important historical events in this area in the last two decades affecting the people’s resource use practices. One was the land reform implemented in 1982, another one was the designation of Hainan Province as a Special Economic Zone in 1988. These events, together with the designation of natural reserve for some areas in 1986 and then the implementation of a law in 1993 prohibiting the burning of trees for shifting cultivation, have created conditions for change in land use practices in the area. These have been manifested in increase in forest resources since people were no longer allowed to cut tree and burn areas for shifting cultivation, and also increasing use of land for cash crops because of push towards a cash economy.
In this background, this study aims to study the dynamics of land use change in the area for the last two decades.
The study area consists of four counties under the administrative jurisdiction of Tonza city, namely, Fan Yang Zheng ( or Banyan), Shui Man Xiang (or Goshizan), Hongshang Xiang and Maoyan Zheng. All these four counties are rural areas inhabited by people of Li ethnic community. The total area is approximately 600 km2 ranging from 109° 19’ 17”E to 109° 44’ 05”E and 18° 47’ 57”N to 19° 02’ 26”N. Figure 1 illustrates the location of the study area. It is a rugged mountainous area, with elevation ranging from a minimum of 290 m to a maximum of 1860 m above mean sea level.
Fig. 1 Map of Tonza city area in Hainan province of China, showing four counties under study
2. Data and Methods
2.1 Data used
Landsat satellite data from 1980 and 1999 have been used for this study. The data for 1980 is Landsat MSS acquired on January 1980 and that for 1999 is Landsat ETM data acquired on January 1999. Besides, topographic map (scale 1:50,000 and contour interval of 100 m) was also used.
2.2 General Methodology
The following is the brief description of methods u sed in this study.
GPS field work
GPS fieldwork was carried out in Septemer 2001, for collecting ground control points for geometric correction and for collecting training data for the classification of satellite data. Differential GPS was carried out using Trimble GPS system using Geo Explorer III and 4600LS as a base, and using the software Pathfinder for differential correction.
Geometric correction
Since the topographic map that was available did not have coordinate information, the geometric correction of the satellite data was carried out using the geometric coordinates of the GCP’s calculated from our GPS field survey. The topographic map was also registered and rectified using these GCP’s so that topographic map and the satellite data are matched in the same map projection.
Classification of satellite data
Training data were collected during field survey, which were later used to make supervised maximum likelihood classification of the satellite data. This was relatively simple for Landsat ETM data, since there was little change in land use condition at the time of the ground truthing (September 2001) compared to the time the data was acquired (January 1999). For the areas where some change was noticed, information from local people was used to ascertain the land cover during the time of satellite data acquisition. However, classification of MSS data was more complex since this data was from 1980. For this, ground truth data were used for known areas, based on the knowledge acquired from the local people who knew of the condition of land cover at that time. Knowledge from our extensive field work at various times was employed for this purpose. Using such ground truth information, a supervised maximum likelhihood classification was performed both on Landsat ETM as well as MSS data to derive the land use/cover classes in 1980 and 1999. The satellite data have been classified into six simplified categories of mature (dense) forest, shrub (sparse forest), grass, paddy, water and bare soil (including built up area). The MSS data for 1980 contains come cloud (about 14% of total area). Therefore, for comparison of land use between 1980 and 1999, only the area, which is not covered by cloud in both images, is considered.
Digital Elevation Modelling
A digital elevation model was prepared based on the topographic map. Even though this topographic map was not very detailed, it could still be used for studying the general topographic conditions of the area and linking the land use/cover with respect to the terrain conditions. For this purpose, maps for height ranges and slope were computed from the DEM, which was then used for relating the land use with topography.
Integration with high-resolution data
Besides the broad analyses of land use/cover change cove ring all the counties, analysis for detailed land use classes has been carried out using high resolution satellite data, IKONOS, for the county of Shui Man Xiang. Details of this are described in a separate paper (Umezaki et al 2002).
3. Results and Discussion
3.1 Overall land use dynamics
Figures 2 and 3 show the results of land use classification for 1980 and 1999 respectively. It can be seen very clearly from these figures and Table 1 that this area has witnessed major change in land use in these two decades, especially in terms of forest cover.
Table 1 Comparison of Land use 1980 and 1999
| Land use/cover | % of total area (1980) | % of total area(1999) | Change |
| Mature forest | 20.74 | 46.66 | +25.92 |
| Shrub | 39.24 | 34.22 | -5.02 |
| Grass | 27.25 | 8.35 | -18.90 |
| Paddy | 8.01 | 6.03 | -1.98 |
| Water | 0.77 | 0.95 | +0.18 |
| Bare/built up area | 3.99 | 2.75 | -1.24 |
| Total | 100 | 100 | ---- |
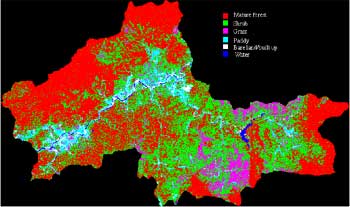
Fig. 2: Land use/cover classes in 1999 based on Landsat ETM data

Fig. 3 Land use/cover classes in 1980 based on Landsat MSS data
Our studies from the field survey show that these results are in line with the history of past laws and policies implemented in the area. In 1986, a major portion of the Shui Man Xiang was designated as a national reserve. And since 1993, burning of areas for shifting cultivation was banned. This in turn has been reflected in the high proportion of mature forest now compared to 1980. Thus there is a major change in conversion of grassland to shrub or mature forest and from shrub to mature forest. Another reason in the high proportion of mature forest in 1999 is the significant proportion of rubber plantation (which may be between 5 to 10% of the total area), which is also included in the mature forest because of its similar spectral signature. A lot of rubber plantation was initiated in the area in the earlier eighties, which now occupies significant proportion of the total land cover. An attempt was made to classify the rubber plantation separately, however, the result was not satisfactory.
3.2 Land use in different counties
An analysis was carried out for land use/cover in different counties within the study area. Table 2 shows the land use/cover for different counties for 1999.
Table 2: Land use 1999 in different counties
| Land use/cover | Fan Yang | Shui Man | Hongshang | Maoyan |
| Mature forest | 61.70 | 43.35 | 30.20 | 50.41 |
| Shrub | 23.00 | 36.94 | 48.15 | 33.69 |
| Grass | 3.28 | 14.58 | 16.99 | 4.84 |
| Paddy | 6.91 | 2.68 | 3.36 | 7.15 |
| Water | 1.24 | 1.25 | 0.11 | 0.80 |
| Bare/built up | 3.78 | 1.87 | 1.19 | 3.10 |
| Total | 100 | 100 | 100 | 100 |
It can be seen from Table 2 that Hongshang has the least area under mature forest while Fan Yang county has the most. A temporal analysis for land use change in each of the county showed that the pattern of land use change is similar in all counties, with a significant increase in mature forest and decrease in grass area over the last two decades.
3.3 Topography and land use
The spatial distribution as well as temporal dynamics of land use was also carried out with respect to topographic variables such as height and slope. Table 3 shows the result of analysis on land use/cover dynamics (Table 3) with respect to height. It shows that while there has been increase in forest cover over the study period in all height zones, there is also increasing dominance of mature forest in the higher elevations. The smaller proportion of mature forest in the elevation in the 601-1000 m range may be because of the abundance of cash crops (such as fruit trees etc, which are included in the shrub because of similar spectral signatures) in the area, and also because this area has quite some part of the mature forest covered by cloud in the image. Also it can be seen that most of the paddy area is in lower elevations, especially in areas less than 300 m.
Table 3: land use/cover change with topography
| < 300 m | 301 – 600 m | 601 – 1000 m | >1000 m | |||||
| 1980 | 1999 | 1980 | 1999 | 1980 | 1999 | 1980 | 1999 | |
| Mature forest | 7.84 | 26.47 | 13.24 | 52.71 | 19.50 | 42.13 | 73.22 | 91.44 |
| Shrub | 38.08 | 34.69 | 58.13 | 37.66 | 34.03 | 39.98 | 13.82 | 6.72 |
| Grass | 22.49 | 6.97 | 23.58 | 3.51 | 36.78 | 14.88 | 6.62 | 1.80 |
| Paddy | 19.06 | 19.44 | 3.78 | 3.66 | 6.62 | 2.15 | 1.66 | 0.03 |
| Water | 1.60 | 2.91 | 0.29 | 1.08 | 0.79 | 0.07 | 0.18 | 0 |
| Bare | 10.66 | 9.52 | 0.99 | 1.38 | 2.27 | 0.80 | 4.49 | 0.02 |
| Total | 100 | 100 | 100 | 100 | 100 | 100 | 100 | 100 |
3.5 Detailed investigation in Shui Man Xiang
Detailed investigation of land use practices adopted by the local community has been investigated for Shui Man Xiang using Space Imaging’s Ikonos multispectral and panchromatic data. This has been described in Pahari et. al. (2002), Umezaki et. al. (2002).
4. Conclusion and Further Works
It can be concluded from our results that there has been drastic land cover change in the four counties of Tonza over the last two decades, as a result of various activities relating to policy measures. The change in land use has been specially significant in conversion of grassland to forest areas. This is a good sign for the environment. However, it has to be linked with its socioeconomic implications. Another significant change observed was the high prevalence of cash crops in the area compared to before, which unfortunately could not be analyzed properly due to the coarse resolution of MSS and ETM data. This has been analyzed for one of the counties namely, Shui Man Xiang, using high- resolution (IKONOS) satellite data.
Further works are underway for refining the results and linking them with the socioeconomic conditions of the people in the area.
Acknowledgement
This study was financially supported from Japan Society for the Promotion of Science (Research for the Future Program, project leader: Professor Ryutaro Ohtsuka) and partly the Japanese ministry of Education, Science, Sports, and Culture
References
- Pahari, K., Umezaki, M., Wei, J.H., “A Study of Land Use and Environment using High and Medium Resolution Satellite Data: a Case Study in Tonza Province, Hainan Islands, China” in Proceedings of 27th International Symposium on Remote Sensing of Environment, Buenos Aires, April 8-12, 200
- Umezaki, M., Pahari, K., and Wei, J.H., “Land Use of the Li-speaking People in a Mountainous Area of Hainan Island, China: Impact of National Nature Reserve Established in 1986” in Proceedings of 222nd Asian Conference on Remote Sensing, Kathmandu, Nepal, November 2002