| GISdevelopment.net ---> AARS ---> ACRS 2002 ---> Data Processing, Algorithm and Modelling |
Wavelet-Based filtering the
cloud points derived from airborne laser scanner
T. Thuy VU
Doctoral Candidate, Space Technology Applications and Research Program
Asian Institute of Technology
P.O. Box 4 Klong Luang, Pathumthani, 12120
Tel: (66)-2-524-6190
Fax: (66)-2-524-5597
Email: rsc009994@ait.ac.th
Thailand
Fumio Yamazaki
Professor, School of Civil Engineering
Asian Institute of Technology
Thailand
Mitsuharu Tokunaga
Associate Professor, Environmental System Engineering
Kanazawa Institute of Technology
Japan
Abstract
In spite of the wide application of airborne laser scanner (ALS) data in topographic mapping recently, the segmentation of this data, usually called filtering process, is still challenging due to the complex distribution of the objects on the earth surface. The authors propose a new method based on a wavelet-based approach to filter the laser scanner data. Wavelet-based filtering algorithm is a detection of the clusters of the laser points across different spatial resolutions. This enabled the classification of objects based on their size and perfectly filters out the unwanted information at a specific resolution. The algorithm, therefore, was named ALSwave (Airborne Laser Scanner Wavelet) method. This study is the testing process of ALSwave on a dense urban area of Tokyo, Japan. The result showed good filtered bare earth surface coupled with the acceptable computational time. Beside a variety of existing algorithm, wavelet-based filtering has been introduced as a potential approach to filter the cloud laser data points and subsequently generate fast and more accurate digital terrain models.
Introduction
The major purpose of segmentation of the airborne laser scanner data can simply be described as the distinction between the bare earth points and the overlying object points. However, objects on the earth surface are complex, and affect the reflectance of laser hit. The existing algorithms could be categorized into two types, i.e. with or without interpolation of the cloud point into regular grid. Filtering the grid-based laser point (Acqua, et. al., 2001; Haala, 1999) is much faster and easier to implement but suffers from the problem of interpolation (Vosselman and Maas, 2001). Alternatively, filtering of raw laser points could avoid the problem caused by interpolation but it pays the cost of computation time and has hardly been implemented in recent studies (Maas and Vosselman, 1999; Roggero, 2001; Sithole, 2001).
The algorithm proposed in this paper concentrates in another point which has not been considered in the existing algorithms. This is the resolution (or scale) to be analyzed. Analysis of the objects in the image or the cloud points at different resolutions has been proved as an excellent approach to detect and extract the target objects (Lega, et. al., 1995; Starck and Murtagh, 1994). The key point is that the objects appear only at a certain range of scale, or resolution. In this study, wavelet algorithm is introduced, for the first time, for the segmentation of airborne laser scanner data. The idea of wavelet, originated in early 20 th century, has been attractive tool with the solid mathematical background in the 1980’s, to several researchers and engineers of different fields. The proposed algorithm applies the redundant a trous algorithm with B3 spline wavelet function (Starck and Murtagh, 1994), to maintain translation invariant, which is required for feature detection. In implementation, the algorithm is a simple convolution with 5x5 mask. The definition of this mask is presented as follow with all elements scaled up to 256.
The developed method for segmentation airborne laser data in this study is based on wavelet, and is called ALSwave (Airborne Laser Scanner Wavelet) method. The outline of this method is presented in the following section.
Wavelet clustering algorithm for filtering airborne laser scanner data-alswave method
ALSwave is proposed as a semi-automatic algorithm to filter the airborne laser scanner data. The complete procedure of processing is shown in flowchart (Figure 1). The step-by-step details of this algorithm are described in the following subtopics.

Figure 1. The flowchart of ALSwave processing
- Interpolation
The planar interpolation method (Behan, 2000) on the triangulated irregular network (TIN) gives the most accurate interpolated image. Therefore, this method was utilized in the ALSwave to serve as the first step of processing.
- Wavelet analysis
Wavelet analysis is the core of ALSwave method. A trous algorithm, as mentioned in Section 2, is applied to build up the multi-resolution framework. The wavelet analysis, therefore, is outlined as follows:
- Input parameter: the number of the resolutions to be analyzed.
- Multi-resolution median filter: the kernel size increases by 2 k + 1, where k=1,2…
- Threshold the median-smoothed images with a threshold of 3 to retain the strong signatures.
- Filter the thresholded images by a trous algorithm (Section 2). Subsequently, differentiate the wavelet-smoothed images at two consecutive resolutions to generate the detailed images.
Wavelet analysis generates a family of smooth and detailed images, which depict the existence of the objects based on their size. In wavelet analysis, the only input parameter is the number of resolutions, which is decided by the operator. It should be known that more resolutions are employed, more information is obtained, and hence longer time is required to process the algorithm.
- Cluster boundary detection
A simple idea on how to detect the cluster boundaries is illustrated in Figure 2. However, due to the effect of interpolation and the gap between the laser points, the edges of the objects could not appear vertically. There is a buffer of edge pixels, named the fuzzy edge pixels. It should be noted that the real location of the edges of the objects must lie within the buffer zone. The fuzzy edge pixels can be clarified by the additional information from other data. Unfortunately, this information was not readily available to this study.
Figure 2. Illustration of the detection of the edge pixels
- Selection of the appropriate resolutions
It is an interactive processing where the operator must choose the appropriate resolutions for further processing. The decision is dictated by the distribution of the objects in the study area and is operating on two limits. While the lower limit deal with the finer resolution that appears at an acceptable level of noise, the upper limit is related to the object’s degree of distortion.
- Detection of object points
By a simple spatial relation of fall-into-boundary, it is possible to distinguish between the qualified object points and the remnants. This processing step is a hybrid method in which the cloud points are grouped and categorized based on the results obtained from the interpolated images. However, there is an ambiguity along the edges of the objects. Due to the unpredicted reflectance of laser hit on the objects and the effect of interpolation, several laser points are classified to the wrong class. Furthermore, the objects such as cars, trees, and poles due to their small size appeared somehow as noise in the previous processing. Therefore, the laser points belonging to these objects still exist in the remnants.
- Detection of the fuzzy edge points and clarification of the wrong
classified points
The existence of fuzzy edge points has been remarked. These fuzzy edge points must appear within the remaining set, acquired from the prior processing. It is necessary to filter them out from the bare earth points. It is obvious that the points belonging to the objects and located at the edges of the objects have a sharp leap in elevation when.compared to the elevation of neighbors. Therefore, elevation threshold is set to classify the fuzzy edge points from the bare earth points. This processing was performed locally using the Voronoi polygon of the points. Let OP is the object point set that has been detected and P as the remainders set of points. The fuzzy edge point is a point that satisfies following condition:
Similarly, the elevation threshold in the Voronoi neighbors could detect the ground laser points that were classified as the object points.
- Global and local thresholding
The cumulative histogram is checked to find whether any laser points appear with very high elevation on the ground by the reflection from the complicated objects of the earth surface. Subsequently, a new Voronoi diagram is generated for the remaining set of points. A slope threshold is carried out iteratively in the local Voronoi neighbor. As a result, the bare earth points are detected which is ready for the reconstruction of the bare earth surface. Finally, based on the bare earth point set detected, a triangulated irregular network (TIN) of the bare earth surface is constructed and the grid-based bare earth surface is generated, subsequently,.
A typical urban area of 300 m x 300 m in Shinjuku, Tokyo, Japan was selected to test the competence of the proposed algorithm. There are lots of buildings along with the crowded human activities in this area. The narrow streets appear in the tiny spaces between the very complex structures of the buildings. In addition, there exist numerous moving objects on the streets, trees aligned along the streets and buildings. The objects with different sizes, which are interspersed each other, typified the area. figure 3 illustrates the digital surface model of the test area.
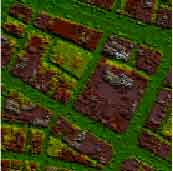
Figure 3. Digital Surface Model of the tested area
Table 1 shows the parameters of the acquired airborne laser scanner data over the test area, which was provided by
| Operation Altitude | 2700 m |
| Scan Swath Width | 720 m |
| FOV | 16 0 |
| Scan Rate | 19.5 Hz |
| Pulse Rate | 15 KHz |
| Cross Track Spacing | 1.93 m |
| Along Track Spacing | 2.83 m |
| X, Y Positional Accuracy | 0.3 m RMSE absolute |
| Z Positional Accuracy | 0.15 m RMSE absolute |
The approximate laser point density of acquired data is 0.2 point/m 2 . It is quite low for such an application of object reconstructing in a highly dense urban area. Due to the big gap between the laser points, it was unable to detect the exact shape of some buildings and hence it was difficult to distinguish trees located close to buildings. The multi-resolution approach could classify the objects based on their size. Therefore, it is applicable in eliminating the unwanted trees located nearby the buildings. Both of the filtering, either directly on cloud points or indirectly on interpolated images, faces unavoidable problem due to this low point density. This is the reason why this study proposed a hybrid method approach for filtering laser scanner data.
Test Result
Figure 4 shows the interpolated image of 1-meter resolution. With the low point density, the better-interpolated resolution could not be achieved
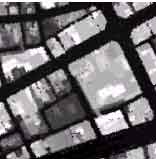
Figure 4. The interpolated elevation image (1 meter resolution)
The wavelet analysis was carried out with 4 employed resolutions. The purpose of the wavelet analysis is to find out the pattern of clustered laser points, and the details existing at different resolutions. The smooth images at three consecutive resolutions are depicted in Figure 5. It is illustrated clearly the idea of multi-resolution approach, i.e. the small objects disappears in the coarse resolutions. This is a great advantage to assist the segmentation task.
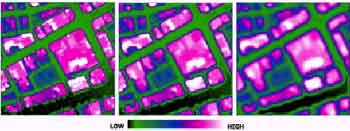
Figure 5. The smoothed images across three consecutive resolutions
Consequently, the boundaries of clusters across different resolutions were distinguished as illustrated in Figure 6. Figure 6a shows the detected boundaries at the finest resolution, which appears very noisy. Two other resolutions,.shown in Figure 6b and Figure 6c, were selected as the appropriate resolutions to construct the boundaries of objects. The wavelet-based algorithm proposed in this study avoids that difficulty in selection of the right size of kernel for filtering by analyzing the data in a multi-resolution space. Simultaneously, the boundaries of clusters are detected and the multi-resolution domain is formed to allow the selection of the appropriate resolutions.
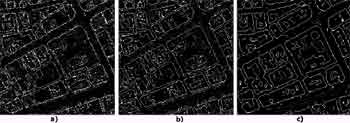
Figure 6. The detected boundaries of clusters across three consecutive resolutions
To distinguish the laser points belonging to the objects, a spatial relation of fall-into-boundary was applied, both in the detected boundaries and on the raw laser points. The effect of interpolation could be adjusted at this step by the combined analysis in both mentioned formats. Subsequently, the fuzzy edge points were also identified with the threshold value of 7 meters, as observed in the testing area. Figure 7 illustrates the histograms of the original point set, the point set after removing the object points, and the fuzzy edge points. There are three peaks in the histogram of the original point set (Figure 7a) where two of them were successfully removed because they belong to the objects (Figure 7b).
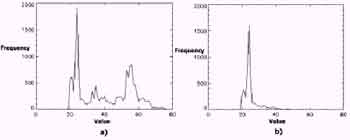
Figure 7. The illustration of histogram of the original laser points (a) and the remnants after removal of the object points and the fuzzy edge points (b)
Prior to the application of the local operator, to remove the laser points belonging to the small objects, a threshold value of 80% was applied in cumulative histogram. This was to discard some laser points with very high elevation and dissimilar from the remnants.
The final stage of segmentation was based on local operator. Figure 8 depicts the results of segmentation into ground and object points, in which the green and red points are symbolized for the bare earth points and the overlying object points, respectively. Figure 9 shows both bare earth surface and original digital surface model to visually compare the result of segmentation.
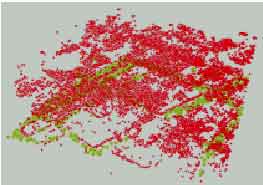
Figure 8. The detected point classes: the object points (red), and the bare earth points (green)
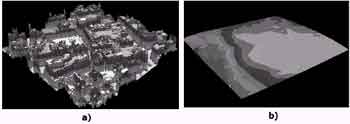
Figure 9. Perspective view of the digital surface model (a) and the detected digital terrain model (b)
Table 2 summarizes the point classes and their quantities. This filtered result needs to be verified either with ground survey data or with large-scale topographic map. Unfortunately, they were not available when this study was carried out.
| Class Number of points | Ground 798 |
| Objects (building) | 13190 |
| Fuzzy edges | 4262 |
| Small objects (masked by cumulative Histogram and local operator) | 2737 |
The computation time is also an important aspect to be considered whenever a new algorithm is proposed. During the processing of the airborne laser scanner data, most of the time is used up for reading the data from and writing the data to files. This is due to the enormous amount of the laser points acquired in the data set. In the proposed algorithm of multi-resolution analysis of this study, the size of resolutions to be employed is the main factor that controls the computation time. If the time required for input and output of the data and the time needed for interactive processing is excluded, the total computation time for the processing will be substantially lower. For instance, the computation time for an image size of 300 m x 300 m carried out on a PC with CPU 600MHz and memory of 256MB is about 182 seconds. Till now, there are no reports regarding the computation time for existing algorithms. Therefore, it is unable to compare the attained time efficiency with other algorithms.
| Task | Time (seconds) |
| Wavelet analysis | 17 |
| Cluster boundary detection | 65 |
| Raster to vector conversion | 90 |
| Detect fuzzy edge points + global and local thresholding | 10 |
| Total | 182 |
Conclusions
This paper has tested the new approach named ALSwave, which has been introduced to process the airborne laser scanner data, in a highly dense urban area in Tokyo, Japan. The result showed a promising result of filtering. All of overlying objects on the earth surface irrespective of their size were removed out to reconstruct the digital terrain model. The testing was carried out in an acceptable time of processing. ALSwave has been fully implemented and continued testing stage in different types of terrain with different characteristics of the overlying objects, which will be presented in further studies.
Refereces
- Ackermann, F., 1999, Airborne laser scanning – present status and future expectation, ISPRS Journal of Photogrammetry & Remote Sensing, 54: 64-67.
- Acqua, F. D., Gamba, P., and Mainardi, A., 2001. Digital Terrain Models in dense urban areas, International Archives of Photogrammetry and Remote Sensing, Volume XXXIV-3/W4, 22-24 October 2001, Annapolis, Maryland, pp. 195-202.
- Axelsson, P., 1999, Processing of laser scanner data – algorithms and applications, ISPRS Journal of Photogrammetry & Remote Sensing, 54: 138-147.
- Behan, A., 2000. On the matching accuracy rasterised scanning laser altimeter data. Proceedings of the XIXth congress of ISPRS, Amsterdam 2000, International Archives of Photogrammetry and Remote Sensing, XXXIII, part B 2, ISSN 0256-1840, pp. 75-82.
- Haala, N. and Brenner, C., 1999, Extraction of buildings and trees in urban environment, ISPRS Journal of Photogrammetry & Remote Sensing, 54: 130-137.
- Lega, E., Scholl, H., Alimi, J. M., Bijaoui, A., and Bury, P., 1995, A parallel algorithm for structure detection based on wavelet and segmentation analysis, Parallel Computing, 21: 265-285.
- Maas, H. G. and Vosselman, G., 1999, Two algorithms for extracting building models from raw laser altimetry data, ISPRS Journal of Photogrammetry & Remote Sensing, 54: 153-163.
- Mallat, S., 1999, A wavelet tour of signal processing, Academic Press, London, 637p.
- Roggero, M., 2001. Airborne Laser Scanning: Clustering in Raw Data, International Archives of Photogrammetry and Remote Sensing, Volume XXXIV-3/W4, 22-24 October 2001, Annapolis, Maryland, pp. 227-232.
- Sithole, G., 2001. Filtering of Laser Altimetry Data using a Slope Adaptive Filter, International Archives of Photogrammetry and Remote Sensing, Volume XXXIV-3/W4, 22-24 October 2001, Annapolis, Maryland, pp. 203-210. Starck, J.L., and Murtagh, F., 1994, Image restoration with noise suppression using wavelet transform, Astronomy and Astrophysics, 288: 342-348.
- Vosselman, G., 2000. Slope based filtering of laser altimetry data, International Archives of Photogrammetry and Remote Sensing, Volume XXXIII, Amsterdam, pp. 935-942.
- Vosselman, G. and Maas, H. G., 2001. Adjustment and filtering of raw laser altimetry data, Proceeding of OEEPE workshop on Airborne Laserscanning and Interferometric SAR for Detailed Digital Elevation Models, 1-3 March 2001, Stockholm, pp. 62-72.