| GISdevelopment.net ---> AARS ---> ACRS 2002 ---> Data Processing, Algorithm and Modelling |
Extraction of linear features
from vehicle-borne laser data
Dinesh
Manandhar
Centre for Spatial Information Science
The University of Tokyo
4-6-1, Komaba, Meguro-ku, Tokyo 153-8505, Japan
Tel: 81-3-5452-6417
Fax: 81-3-5452-6414
E-mail: dinesh@skl.iis.u-tokyo.ac.jp
Website: http://shiba.iis.u-tokyo.ac.jp/
Ryosuke Shibasaki
Centre for Spatial Information Science
The University of Tokyo
4-6-1, Komaba, Meguro-ku, Tokyo 153-8505, Japan
Tel: 81-3-5452-6417
Fax: 81-3-5452-6414
E-mail: shiba@skl.iis.u-tokyo.ac.jp
Website: http://shiba.iis.u-tokyo.ac.jp/
Centre for Spatial Information Science
The University of Tokyo
4-6-1, Komaba, Meguro-ku, Tokyo 153-8505, Japan
Tel: 81-3-5452-6417
Fax: 81-3-5452-6414
E-mail: dinesh@skl.iis.u-tokyo.ac.jp
Website: http://shiba.iis.u-tokyo.ac.jp/
Ryosuke Shibasaki
Centre for Spatial Information Science
The University of Tokyo
4-6-1, Komaba, Meguro-ku, Tokyo 153-8505, Japan
Tel: 81-3-5452-6417
Fax: 81-3-5452-6414
E-mail: shiba@skl.iis.u-tokyo.ac.jp
Website: http://shiba.iis.u-tokyo.ac.jp/
Abstract
In this paper, we focus our discussion on auto- extraction of linear features like guard-rails (a fence line at the edge of the road or middle of the road) from vehicle- borne laser data. The vehicle-borne laser data is quite heterogeneous in nature as we scan the objects while the vehicle is moving. In order to extract, linear features, the laser data are projected on the horizontal plane and then rasterized. The raster data contains grid density image and maximum height image, which are used for assisting in decision-making process for linear features. The raster data is further converted to binary image using threshold values for linear features. Radon transformation is applied on the binary image to identify the seed position and orientation of the most probable linear features. Arbitrary seed lines are drawn from these seed points. These seed points (and lines) coordinate information are then converted back to the vector data (original laser points). A circle growing technique is applied on the seed points to correct the seed position of the linear feature points at certain horizontal spacing. Once all the seed points are corrected on the original data, straight lines are fitted (locally) to represent the linear features. The height of the linear feature is computed by fitting the maximum height values of the points that fall inside the circle (during the circle growing process). This gives us 3-D modeling of linear features.
It is possible to identify linear features from vehicle-borne laser data. The algorithm is successful in extracting the linear features automatically for continuous linear features. If the linear features are non- continuous (or smaller spans of a few meters) or data are occluded, auto-extraction will be quite complex and might even fail to identify. In this case, a semi-automated extraction is recommended.
Introduction
Laser point data scanned from vehicle-borne platform can be used for 3- D modeling of various urban features. Apart from building faces, roads and trees, there are many other features that can be modeled from laser data. Some of these are cables, poles, fence or guardrails, tunnels, vehicles and pedestrians. Refer Manandhar & Shibasaki, 2001 for details on extraction of some of these features. In this paper we are focusing on the possibility of automated extraction of linear features (especially guard rails) from laser data. The range data used no other information except the range distance itself. The data are bare 3-D real world coordinates. Figure 1 shows the mapping vehicle equipped with the laser scanning system.
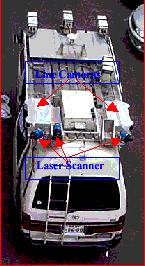
Figure 1: Vehicle- borne
Laser Mapping System
Linear Feature Extraction
- Definition
We define linear features that exhibit laser points with linear geometry when viewed along the vehicle trajectory (along track). For example, laser points reflected by cables, guardrails etc are defined as linear features. However, laser points reflected by poles are not classified as linear features since they exhibit points linearly along the scanning direction but not along the vehicle trajectory (across track).
- Linear Feature Extraction
There are different approaches to segment range data. These approaches basically depend on the type of range data and the features we would like to extract. Refer Hoover et al for comparative study of various range image segmentation algorithms. These algorithms are developed for fixed platform. Range data may be either in grid format (2.5D) or point cloud format (3D). The range data we use are point cloud data that have only 3- D coordinates. The data have already been filtered for the road and non -road data. We use only the non-road data to identify linear features.
The feature extraction is basically done in three major steps, (a) conversion to raster image and image analysis (b) Identify seed points by performing radon transformation and ( c) correct seed points / lines by fitting the identified points / lines.
- Image Creation and Analysis
Raster image is created from point cloud laser data. A blank grid is defined with equal height and width grid size. The grid size is fixed at 20cmx20cm. It is not necessary to keep the square grid size. The grid size can be varied based on the laser scanner’s along- track resolution (distance between the successive scan lines). We have found that 20cm grid is effective for our data. The size (height and width) of the blank grid is defined by the extents of the x and y coordinates of the laser data. Z-coordinate represents the height data. After, defining the blank grid, the laser data are projected on the horizontal plane (x- y plane). We can create different types of images while projecting the laser points on the grid, e.g. density image, maximum height image or average image. Density image shows the number of laser points falling on each grid. This is simply the count of the laser points falling on each grid. Linear features like guardrails, and cables exhibit very low value on this image. Maximum or minimum height image shows the maximum or minimum height value of each grid. This is created by computing the maximum or minimum height of all the points falling on each grid. Building faces will exhibit higher grid value on maximum height image, where as guardrails exhibit lower value on maximum height image as they appear at lower height compared to the building (roof edge of the building). Average image is created by computing the average height value of all the laser points falling on each grid. Density image and maximum height images are created for visualization purpose to show the appearance of different features when such images are created from laser point cloud data. Figure 2
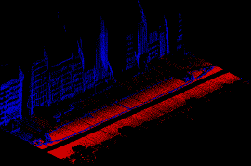
Figure 2: Road and non-road Classified Laser Points. Red – Road Points Blue – non- road points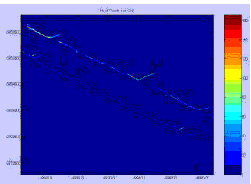
Figure 3: Density Image (Number of Laser Points per Grid).
shows the classified road and non- road laser point data. The road data are shown in red color points and non-road data are shown in blue color points.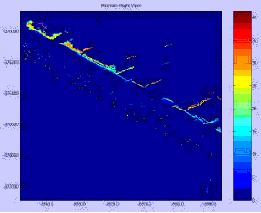
Figure 4: Maximum Height Image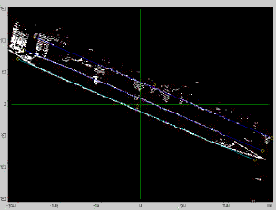
Figure 5: Binary Image overlaid with straight lines from radon transformation.
- Binary Image Creation
Binary image is created by filtering the image using maximum and minimum height threshold values. This is set based on the definition of the guardrail. Guardrails are assumed to be about one meter higher from the road surface. The height value of each laser point is normalized before creating the image. The normalization is done by making the road surface height equal to zero. Thus any point that is at a height of one meter from the road surface will have height value one meter. The guardrails generally appear along the roadsides or the road as well to separate the driving lanes. Normally, guardrails have height of about one meter. Thus we set maximum height threshold value of 1.2m and minimum height threshold of 0.2m. By setting these threshold values, we will be sel ecting the grids on the image that have values from 0.2m to 1.2m. By changing these threshold values other linear features (like cables) can also be identified, though they need further analysis. Figure 5 shows the binary image. We can see at least two linear features (guard rails) clearly and the third one is also seen but it is not continuous as the other two.
- Line Detection by Radon Transformation
Radon transformation is used to detect the lines on the binary image. Hough Transformation is another alternative approach. We have assumed that linear features resemble straight lines rather that the curved ones.
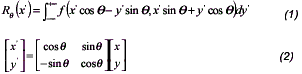
The radon transform represents an image as a collection of projections along various directions. Projections can be computed along any angle þ. In general, the Radon transform of f(x,y) is the line integral off parallel to the y´ axis. It is given by equations 1 and 2.
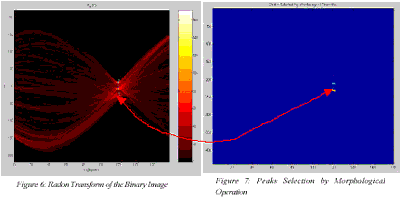
However, radon transform simply provides the direction where the straight lines appear. Thus it is not possible to know the actual length of the line segment. It is also not possible to identify the individual lines if the lines fall on the same direction. Thus we select the prominent peaks from the radon image as seed line direction. These seed points or lines are further used to identify the actual lines on the image. The selection of peaks from the radon image is done by morphological operation on the radon image. The morphological operation involves, dilation using structuring line elements and threshold value (of radon space).
Figure 6 shows radon transform of the binary image shown in figure 5. Figure 7 shows the result of morphological operation of radon image to select only the peak values. These peak values are taken as the orientation of major linear features on the image. The peaks thus identified are used to generate candidate straight lines. These straight lines are plotted over the binary image as shown in figure 5.
- Correction of Identified Linear Features
The straight lines detected by radon transform indicate only the orientation of lines on the image. It does not show the true segment or shape. The peak on the radon image is due to the longest line section on the image. We need to further analyze the identified lines for true orientation and length. This is accomplished by using circle- growing. Circle growing analysis is done to see whether the laser points correspond to every section of the line segment. This analysis is done on the laser point data. The point coordinate corresponding to the peak of the identified line is taken as the initial seed point for circle growing. Circles of radius 25cm are grown at every line section till we get some laser points inside the circle. The circle grown is terminated if no laser points are found when the radius has grown to two meter. This indicates that there is no line segment at this point or the linear feature is not continuous. A radius of two meter corresponds to a search radius of five pixels on either side of the line / point on the image. Once the laser points are found inside the circle, the growth is checked and the mean of the x and y coordinates are taken as the new point (on the new line segment). Minimum and maximum height values of the laser points that fall inside the circle are also computed. This is performed for every line segment. The single line identified from radon transform is now divided into several segments, depending on the circle radius. Line
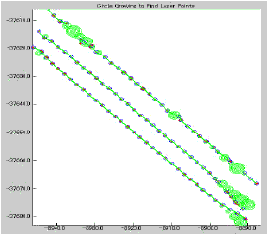
Figure 8: Circle growing at every line segment (point) to identify true laser point position.
segments having the same circle radius are grouped together and forms one single segment. Figure 8 shows the results of circle growing.
The line generated by connecting these points may not be a straight line. So, we perform a robust straight-line (2- D) fitting. The robust line fitting is immune to outliers. Robust fitting is also applied to maximum and minimum height data separately. Thus we get fitted x, y, zmin and zmax coordinates for each line segment. Using these coordinates, 3- D patches are created to represent the guardrails from the vehicle-borne laser data. The final result is shown in figure 9.
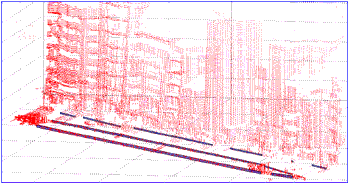
Figure 9: 3- D Model of linear feature (Guardrail) extracted automatically from laser point data. The feature is overlaid with laser point data for verification.
It is possible to identify linear features from vehicle- borne laser data. The algorithm is successful in extracting the linear features automatically for continuous linear features. If the linear features are non-continuous (or smaller spans of a few meters) or data are occluded, auto-extraction will be quite complex and might even fail to identify. In this case, a semi-automated extraction is recommended. The data in reality have both continuous and non- continuous linear features. Thus the extraction of all linear features automatically is only partially successful. However, the algorithms can be used to identify the possible linear features in semi-automated process where the user needs to identify laser points that are reflected by the linear features. This will reduce the operation time to some extent or ease the manual operation.
References
- Hoover, A., Jean-Baptiste, G., Jiang X., J., Flynn, P.J., Bunke H., Goldgof, D., Bowyer K., A Comparison of Range Image Segmentation Algorithm, URL: http://marathon.csee.usf.edu/range/seg-comp/%20SegComp.html
- Manandhar, D., Shaibasaki, R., 2001, Proceedings of ACRS 2001– 22 ndAsian Conference on Remote Sensing, 5-9 November 2001, Singapore, Vol. 2, pp 1113 – 1118