| GISdevelopment.net ---> AARS ---> ACRS 2002 ---> Data Processing, Algorithm and Modelling |
Automated DEM generation from
SPOT imagery
Zhen Xiong
Centre for Remote Imaging, Sensing and Processing
National University of Singapore Blk. S17 Level 2
Lower Kent Ridge Road, Singapore 119260 Fax: (+65) 67757717,
Email: crsxz@nus.edu.sg
Xiaojing Huang
Centre for Remote Imaging, Sensing and Processing
National University of Singapore Blk. S17 Level 2
Lower Kent Ridge Road, Singapore 119260 Fax: (+65) 67757717
Email: crshxj@nus.edu.sg
Leong Keong Kwoh
Centre for Remote Imaging, Sensing and Processing
National University of Singapore Blk. S17 Level 2
Lower Kent Ridge Road, Singapore 119260 Fax: (+65) 67757717
Email: crsklk@nus.edu.sg
Soo Chin Liew
Centre for Remote Imaging, Sensing and Processing
National University of Singapore Blk. S17 Level 2
Lower Kent Ridge Road, Singapore 119260 Fax: (+65) 67757717
Email: crslsc@nus.edu.sg
Centre for Remote Imaging, Sensing and Processing
National University of Singapore Blk. S17 Level 2
Lower Kent Ridge Road, Singapore 119260 Fax: (+65) 67757717,
Email: crsxz@nus.edu.sg
Xiaojing Huang
Centre for Remote Imaging, Sensing and Processing
National University of Singapore Blk. S17 Level 2
Lower Kent Ridge Road, Singapore 119260 Fax: (+65) 67757717
Email: crshxj@nus.edu.sg
Leong Keong Kwoh
Centre for Remote Imaging, Sensing and Processing
National University of Singapore Blk. S17 Level 2
Lower Kent Ridge Road, Singapore 119260 Fax: (+65) 67757717
Email: crsklk@nus.edu.sg
Soo Chin Liew
Centre for Remote Imaging, Sensing and Processing
National University of Singapore Blk. S17 Level 2
Lower Kent Ridge Road, Singapore 119260 Fax: (+65) 67757717
Email: crslsc@nus.edu.sg
Abstract
This paper presents a new method for fully automated DEM generation from SPOT imagery. It contains three main steps: Seed points extraction, weighted altitude prediction by multiple seed points, and image matching. A pair of SPOT images over Hongkong is used to test this method. The whole procedure is fully automated. No manual editing is made on the DEM generated by the program. The DEM’s accuracy is checked at the tie points. The mean disparity is 0.53 meters and the standard deviation is 19.2 meters.
Introduction
A Digital Elevation Model (DEM) is one of the most important data set used for geo-spatial analysis. Unfortunately, DEMs of sufficient point density are still not available for many parts of the earth, and when available they do not always have sufficient accuracy. Since a DEM enables easy derivation of subsequent information for various applications, extracting digital elevation models from remote sensing data has become an important part of international research and development (R&D) programs related to geo-spatial data [10].
Various methods of generating a digital elevation model (DEM) using remote sensing data have been investigated. One of the methods is to use two images at a time for the reconstruction of a three dimensional stereo model in which the altimetric information can be extracted [9]. This method generally contains three basic steps: setting up sensor mathematical model to reflect the relationship between points on the ground and pixels on the image, performing image matching to get a disparity map, and finally computing each point’s altitude.
Stereo image matching is the most difficult step in the process of DEM extraction. For a given pixel on an image, its corresponding point on the other image is generally searched within a window by image matching. This window is called the search window. If the size of the search window is too big, the matching procedure.will be very slow and the probability of erroneous matching will also be high. But if the search window is too small, there is a high probability that the corresponding point is located outside the search window. So it is very important to choose an optimal size of the search window. A compromise is needed between the two errors mentioned above. Firstly we should ensure that the corresponding point is located within the search window, later on we should reduce the size of the search window as much as possible in order to reduce the probability of incorrect matching.
There are several matching methods that limit the size of the search window. The vertical line locus (VLL) method [12] adopts a search window that contains all the possible corresponding points. This window contains the vertical line locus such that the altitude ranges from a minimum value to a maximum value. So it actually uses a very large search window. Obviously, this matching method is very slow. Due to the large size of the search window, the probability of incorrect matching is very high. The DEM generated with this method always contains much noise caused by false matches.
The Brockelbank’s hybrid matching model [1] uses feature-based image matching to first extract some seed points, and then uses a cubic polynomial to model the horizontal and vertical disparity of every point. If the seed points distribute normally, the result of this method is good. Otherwise, e.g. in the mountainous area, the fitting error of the polynomials may be very big. Zhang [11] uses many tie points selected manually to build up a Delaulay triangulation network, and then interpolates every point’s altitude. He uses this method to realize three- dimensional reconstructions.
The new method presented in this paper use several criteria to extract seed points, and then use these seed points to estimate the altitude of the other points surrounding the seed points, and finally image matching is performed. During the matching procedure, the seed points are extracted simultaneously. This procedure is iterated until a complete DEM is generated.
Extraction of seed points
We generate seed points automatically based on some constraints. For every point (X,Y) on the earth surface, the radius R of the search window is set. If the initial altitude H at (X,Y) can be estimated, then we can search for the best position of its corresponding point in the left image within the range H-R to H+R.
Then according to the point’s position (X,Y) and its altitude H-R and H+R, we can calculate its position on the left image and the right image. The cross correlation score is then calculated. So a sequence of correlation score is achieved. We called this sequence of correlation scores a correlation curve (figure 1).

Through analyzing this correlation curve, we use several constraints to extract seed points. The constraints are set such that only points with correlation values greater than a predetermined threshold and whose correlation curves have one and only one peak not located at the boundary are chosen (e.g. figure 1 þ, þ).
The texture index of gray variation of the matching patches must also lies above a threshold. This constraint is necessary to eliminate spurious matching in areas whose texture index is very small (e.g. water), but with a high correlation score.
Altitude Estimating
Once a seed point has been extracted, its neighbor points’ altitude can be estimated. Suppose that point i is a seed point, and its altitude is Hi. Point j is its neighbor point. If the gradient of point i to point j is K, and the distance between i and j is S, we may estimate that the altitude range of point j is around Hi -S*K to Hi+S*K.
Thus how to choose the gradient limit is the key to estimating pixels’ altitudes. Generally a little altitude range is expected. The less the gradient, the less is the altitude range. According to Lu et. al. [3], the gradient of point i to point j should meet the qualification of a smooth terrain. They consider the terrain to be not smooth such that point i and point j are not compatible if the gradient of point i to point j is greater than 1. This assumption is theoretically correct. However, if there is some error in Hi, the estimated altitude range (Hi-S*K, Hi+S*K) may not be correct. The risk that the estimated altitude range does not contain the correspondence point will then increase.
Once the altitude range is wrong, no matter how accurate the image matching is, it is not possible to get the correct matching result. A gradient limit of 1 may not be suitable and a gradient limit of 2 is used by some researchers [11]. As the gradient limit increases, the estimated altitude range will become greater and greater. The increasing altitude range will result in an increase in the probability of false matching which is not desirable. In fact, no matter what gradient limit is used, we do not know whether the estimated altitude range is correct. The only thing we can do is to minimize the probability of wrong estimation and the probability of incorrect matching.
In order to reduce the probability of wrong estimation, we adopt a muti-point estimating schedule. For one seed point, all its neighbor points’ altitudes are estimated. For each point to be estimated, if there are more than 1 seed points around it, then the weighted mean value of all the seed points’ altitude is used.
Geometric Rectification to Matching Patch
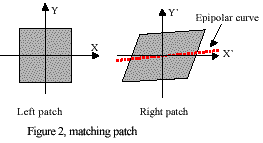
Because of different sensor attitudes, the same matching patch has different shapes on the left image and the right image. For a rectangular matching patch in the left image, its corresponding matching patch is no longer rectangular (figure 2). The distortion mainly is caused by rotation and different image scale. In order to reduce the matching error and increase the stability of image matching, geometric rectification is performed on the matching patch before matching. For a pixel on the left image, we may use equation (2) to calculate its epipolar curve on the right image [7],

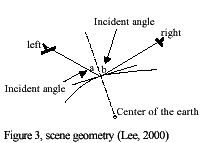
where i and j are respectively the row and column indices of a pixel on the left image, i’ and j’ are row and column indices of the corresponding pixel on the right image. Ai are coefficients based on the sensor model. A short segment of this epipolar curve can be approximated as a straight line. The rotation angle can then be calculated using two points on this epipolar curve. Euation (3) is used to calculate the image ratio [2].

where a is the incidence angle of left image and b is the incidence angle of right image respectively (figure 3).
Experiment
We use a pair of SPOT images of Hong Kong to test our DEM generating program (figure 4). The left image is received on October 1, 1996. Its orientation angle is 11 degree and incidence angle is 30 degree. The right image is received on January 2, 1996. Its orientation angle is 8.8 degree and incidence angle is 13.8 degree . Firstly, we use 20 tie points to refine the sensor model previously developed at the Center for Remote Imaging, Sensing and Processing. The method described in this paper is used to generate the DEM automatically. The generated DEM is shown figure 5.
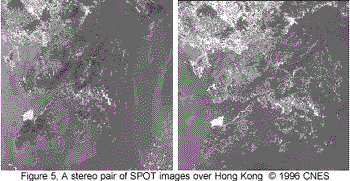
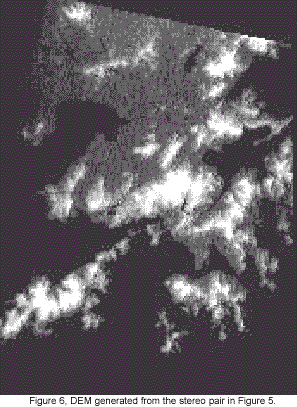
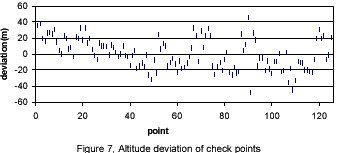
In order to assess the accuracy of the DEM, we use 126 tie points manually selected to check its accuracy. We compare the altitude of the DEM with the altitude calculated with tie points. The altitude disparity of each point is shown in figure 7. The altitude standard deviation is 19.27 meters. The mean deviation is 0.53 meters and the absolute mean deviation is 16.15 meters. Figure 5, A stereo pair of SPOT images over Hong Kong © 1996 CNES.Figure 6, DEM generated from the stereo pair in Figure 5.
Conclusion
We have presented a fully automated method of DEM generation from SPOT imagery. From the experiment result and the accuracy assessment, it is apparent that in terms of geometric accuracy the new method produces an acceptable result for topographic mapping. However, in many areas, especially in the area where terrain features are rare, there is still much noise caused by false matching. Thus the altitude accuracy of the DEM still needs improvement in those areas.
References
- Doug C. Brockelbank. Stereo Elevation Determination Techniques for SPOT Imagery. Photogrammetric Engineering & Remote Sensing, Vol. 57, No. 8, August 1991, pp.1065-1073.
- Lee Hae-Yeoun, Wonkyu Park, Taejung KIM, Heung Kyu Lee, Tag-gon Kim. The Development of An Accurate DEM Extraction Strategy for Satellite Image Pairs Using Epipolarity of Linear Pushbroom Sensors and Intelligent Interpolation Scheme. ISPRS 2000, Amsterdam.
- Lu Yihui, Kurt Kubik and Mohammed Bennamoun. Stereo Image Matching Based on Probability Relaxation. IEEE 1997 TENCON-Speech and Image Technologies for computing and Telecommunications. pp. 315-318, 1997.
- N. AI-Rousan, P.Cheng, etc. Automated DEM Extraction and Orthoimage Generation from SPOT Level 1B Imagery, Photogrammetric Engineering & Remote Sensing, 63(8): 965-974, 1997.
- Peter Werth, Stefan Scherer. A Novel Bidirectional Framework for Control and Refinement of Area Based Correlation Techniques. IEEE 2000.
- Rajiv Gupta. Linear Pushbroom Cameras. IEEE Transactions on Pattern Analysis and Intelligence. Vol. 19, No. 9, 1997.
- Taejung Kim, A Study on the Epipolarity of Linear Pushbroom Images. Photogrammetric Engineering & Remote Sensing. Vol. 66, NO. 8, August 2000, 961-966.
- Thierry Toutin, Evaluation of Radargrammetric DEM from RADARSAT Images in High Relief Areas. IEEE Transactions on Geoscience and Remote Sensing. Vol. 38, No. 2, March, 2000.
- Thierry Toutin. Generating DEM from Stereo Images with a Photogrammetric Approach: Examples with VIR and SAR Data. EARSeL Journal “Advances in Remote Sensing”, Vol. 4, No. 2, pp. 110-117, 1995.
- Thierry Toutin, Laurence Gray. State-of-the-art of Elevation Extraction from Satellite SAR Data.
- Zhang Zh enyou and Shan Ying. A Progressive Scheme for Stereo Matching, SMILE 2000, LNCS 2018, pp. 68-85, 2001.
- Zhang Zuxun and Zhang Jianqing. Digital Photogrammetry. Publishing House of Wuhan Technical University of Surveying & Mapping. Pp. 168-169, 1996.