| GISdevelopment.net ---> AARS ---> ACRS 2000 ---> Water Resources |
Reservoir Trophic State
Evaluation using Landsat TM Data
Ke-Sheng Cheng and
Tsu-Chiang Lei
Associate Professor and Ph.D. Candidate
Agricultural Engineering Department / Hydrotech Research Institute,
National Taiwan University,
Taipei, TAIWAN
Tel: +886-2-2366-1568, Fax: +886-2-2363-5854
E-mail: rslab@ccms.ntu.edu.tw
Key Words:Associate Professor and Ph.D. Candidate
Agricultural Engineering Department / Hydrotech Research Institute,
National Taiwan University,
Taipei, TAIWAN
Tel: +886-2-2366-1568, Fax: +886-2-2363-5854
E-mail: rslab@ccms.ntu.edu.tw
trophic state index, reservoir, random field simulation, remote sensing
Abstract:
Reservoir water quality is traditionally monitored and evaluated based on field data collected at limited locations. Whether the limited field data represent the overall trophic state of a vast water body is often disputed. In this study we utilize Landsat TM data to evaluate the overall trophic state of Te-Chi Reservoir in Central Taiwan. Three water quality parameters: chlorophyll-a (Chla) concentrations, total phosphorous (TP) measurement, and secchi disk depth (SDD), are found to have high correlations with transformed spectral features derived from bands 1, 2, 3 and 4 of TM data. Therefore, TM data are used to yield a trophic-state-index (TSI) map of the reservoir. Ranges of Chla, TP, and SDD measurements in Taiwan's reservoirs are generally much larger than that of Minnesota's lakes which original TSI model was developed; therefore, a modified TSI model was proposed for Techi Reservoir. Based on measurements of water quality parameters, TSI cutoff values of 66 and 78 are used to signify the reservoir trophic state of eutrophication and hypereutrophication. In order to provide a confidence level for reservoir trophic state evaluation, we employ a two-dimensional random field simulation technique to generate a large pool of TSI realizations. Using these realizations, probability distributions of the trophic states of specific reservoir cross-sections and the reservoir as a whole can be estimated. A probabilistic approach of reservoir trophic state evaluation is proposed as follows: the overall reservoir trophic state is considered eutrophic or hypereutrophic if the probability that the overall TSI exceeds the cutoff value (66 or 78) is greater than a predetermined level, say 0.9. Based on this criterion, the trophic state of Te-Chi reservoir is found to be eutrophic in summer and meso-eutrophic in winter.
1. Introduction
Traditionally the quality and trophic state of water in impoundments have been assessed using limnological methods and laboratory analyses of field-sampled data. Single- and multi-parameter indices were developed for trophic classification of lakes (Brezonik and Shannon, 1971; Beeton and Edmonson, 1972). Carlson (1977) proposed a trophic state index (TSI), that retains the expression of the diverse aspects of the trophic state found in multi-parameter indices yet also has the simplicity of a single parameter index, for water quality assessment of impounded water bodies. Carlson's trophic state index can be computed from any of three interrelated water quality parameters: secchi disk depth (SDD), chlorophyll-a concentration (Chla), and total phosphorous measurement (TP). The index has since then been widely accepted owing to its calculation simplicity and ability to communicate between researchers, government agencies, and local community residents.
Determination of trophic state using field-collected water quality data is time and cost consuming, and whether the limited number of field data can adequately represent the overall quality of a vast water body is often disputed. To circumvent the disadvantages of traditional data-collection method, utilization of remote sensing data for water quality assessment has been investigated. Previous work (Lillesand, et al., 1983; Ekstrand, 1992; Tassan, 1993; Lavery et al., 1993; Han, 1997; Rundquist, 1997; Avard et al., 2000: Thiemann and Kaufmann, 2000) has shown that remote sensing data can not only be used to estimate certain individual water quality parameters, these data can also be related to trophic state indices developed from single or multiple water quality parameters.
Although empirical models have been developed for water quality monitoring using remote sensing data, most of these studies were conducted in coastal or estuarine waters, or used field-spectrometer measurements in inland lakes. Also chlorophyll and sediment concentrations in several Taiwan's reservoirs are found much higher than that reported in above studies. Therefore, the objective of this study is to use TM data to determine water quality of the Te-Chi reservoir, located in Central Taiwan, and give a probability-based decision on the overall trophic state of the reservoir.
2. Carlson Trophic State Index
Carlson's TSI model converts raw data of SDD, Chla, and TP to a standard numerical scale ranging from 0 to 100 based on empirical relationships between water quality parameters. Individual indices are calculated by the following equations:
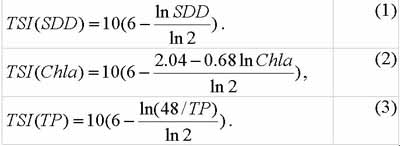
The units are meters for SDD and mg/l for Chla and TP. A commonly applied criterion for trophic classification of lakes is: Oligotrophic - TSI £ 40; mesotrophic - 40 < TSI £ 50; eutrophic - 50 < TSI.
3. Study Area and Data
Te-Chi reservoir, located in Central Taiwan, with a drainage basin of 592 km2, has multiple functions including water supply for domestic use, irrigation, flood control, and a hydropower plant. The reservoir pool is approximately 14km long and covers an area of 454 hectares. Based on local relationships between water quality parameters, the following modified TSI model was developed for Te-Chi reservoir:
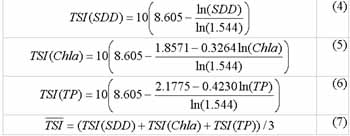
TSI cutoff values are 0:52 for oligotrophic, 53:60 for mesotrophic, 61:65 for meso-eutrophic, 66:77 for eutrophic, and 78:100 for hypereutrophic. These categories reflect the reservoir's nutrient and clarity levels.
4. TSI Estimation using LANDSAT TM Data
Landsat TM data from four dates (8/23/1993, 10/17/1994, 1/10/1995, and 7/22/1996) were analyzed. Corresponding to each TM image, water quality samples were collected at five cross sections within the reservoir pool. Digital numbers of TM bands 1, 2, 3, and 4 are related to water quality parameters:

Combining use of Eqs.(4)-(7) and Eqs.(8)-(10) yields pixel-based images of the reservoir pool. The overall reservoir trophic state index is expressed as the areal average of

where
 (x) represents the pixel-based TSI value
and W the area extent of the reservoir pool.
(x) represents the pixel-based TSI value
and W the area extent of the reservoir pool. 5. Random Field Simulation
In order to develop a probabilistic approach of reservoir trophic state evaluation, a geostatistical random field simulation model HYDRO_GEN (Bellin and Rubin, 1996) is utilized to generate six hundred realizations using parameters mean, variance, and variogram obtained from the TM-derived
image. A brief summary of theoretical
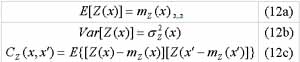
background of the HYDRO_GEN is given below. Let the mean, variance, and covariance function of a Gaussian random field Z(x) be
Initially we can generate a realization of Z(x0), i.e., z(x0), by a standard random generator. Given z(x0), the conditional mean and variance of Z(x1)are, respectively,
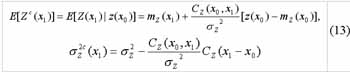
Therefore, a realization of Z(x1)given z(x0)can be generated using the above parameters. A general form of HYDRO_GEN is given below:
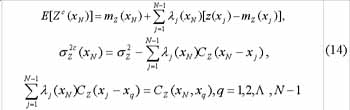
Using Eq. (14) a realization of given Z(xn), z(xj)j =1,2,…, N-1, can be generated.
The date-specific
image
derived from a set of Landsat TM data is considered one realization of the
embedding random field that characterizes the spatial variation of . The probability distribution of  is then estimated using these generated
realizations. Table 1 demonstrates distribution parameters of for four Landsat images.
is then estimated using these generated
realizations. Table 1 demonstrates distribution parameters of for four Landsat images. | Image Date | 31/08/1993 | 05/10/1994 | 09/01/1995 | 22/07/1996 |
| Mean | 79.82 | 71.99 | 64.98 | 74.17 |
| Std. Dev. | 0.06 | 0.05 | 0.03 | 0.07 |
6. Probabilistic Evaluation of Reservoir Trophic State
To circumvent the dispute about the overall trophic state of the reservoir, we adopt a probabilistic approach for reservoir trophic state evaluation. A reservoir is considered eutrophic (or hypereutrophic) if the probability that
exceeds the
cutoff value (vc) of 66 (or 78) is greater than a pre-specified level
a , i.e. 
In this study the level a is set to be 0.90. Overall reservoir trophic states determined by the proposed probabilistic approach were compared against the trophic states determined by using the average TSI values at the five data-collection locations. Table 2 indicates that the trophic state of Te-Chi reservoir tends to be eutrophic or hypereutrophic in summer, and the trophic state may be better in winter, e.g. meso-eutrophic from the 09/01/1955 TM image.
| Image Date | 31/08/1993 | 05/10/1994 | 09/01/1995 | 22/07/1996 |
| (Trophic State) | 79.82 (Hypereutrophic) | 71.99 (Eutrophic) | 64.98 (Meso-eutrophic) | 74.17 (Eutrophic) |
| 5-point (Trophic State) | 78.35 (Hypereutrophic) | 79.71 (Hypereutrophic) | 63.51 (Meso-eutrophic) | 79.47 (Hypereutrophic ) |
7. Conclusions
We demonstrate that reservoir water quality parameters are highly correlated with transformed spectral features of the Landsat TM data, particularly TM2 and TM4. Using the empirical relationships between TM data and three water quality parameters, SDD, Chla, and TP, reservoir TSI map can be created. By means of a random field simulation technique, sufficiently large pool of realizations that characterize the spatial distribution of is generated, and the probability distribution function of the overall trophic state index can be estimated. Based on the criterion of exceedence probability , we find that the Te-Chi reservoir is eutrophic in summer, and maybe meso-ereutrophic in winter. This preliminary results demonstrate the potential of combining usage of TM data and geostatistical modeling for probabilistic evaluation of environmental topics.
References
- Avard, M.M., Schiebe, F.R., and Everitt, J.H., 2000, Quantification of chlorophyll in reservoirs of the Little Washita watershed using airborne video, Photogrammetric Engineering and Remote Sensing, 66(2):213-218.
- Beeton, A.M. and Edmonson, W.T., 1972. The eutrophication problem. Journal of the Fisheries Research Board of Canada, 29: 673-682.
- Bellin, A. and Rubin, Y., 1996, HYDRO_GEN: a new random field generator for correlated properties, Stochastic Hydrology and Hydraulics, 10(4):253-278.
- Brezonik, P.L. and Shannon, E.E., 1971. Trophic state of lakes in north central Florida. Water Resources Research Center Publication 13. 102p.
- Carlson, R.E., 1977, A trophic state index for lakes, Limnology and Oceanography, 22(2):361-369.
- Ekstrand, S., 1992, Landsat TM based quantification of chlorophyll-a during algae blooms in coastal waters, International Journal of Remote Sensing, 13(10):1913-1926.
- Han, L., 1997. Spectral reflectance with varying suspended sediment concentrations in clear and algae-laden waters. Photogrammetric Engineering and Remote Sensing, 63(6): 701-705.
- Han, L. and Rundquist, D.C., 1997. Comparison of NIR/red ratio and first derivative of reflectance in estimating algal-chlorophyll concentration: a case study in a turbid reservoir. Remote Sensing of Environment, 62: 253-261.
- Lavery, P., Pattiaratchi, C., Wyllie, A., and Hick P., 1993, Water quality monitoring in estuarine waters using the Landsat Thematic Mapper, Remote Sensing of Environment, 46:265-280.
- Lillesand, T.M., Johnson, W.L., Deuell, R.L., Lindstorm, O.M., and Meisner, D.E., 1983, Use of Landsat data to predict the trophic state of Minnesota lakes, Photogrammetric Engineering and Remote Sensing, 49(2):219-229.
- Tassan, S., 1993, An improved in-water algorithm for the determination of chlorophyll and suspended sediment concentration from Thematic Mapper data in coastal waters, International Journal of Remote Sensing, 14(6):1221-1229.
- Thiemann, S. and Kaufmann, H., 2000. Determination of chlorophyll content and trophic state of lakes using field spectrometer and IRS-1C satellite data in the Mecklenburg Lake District, Germany. Remote Sensing of Environment, 73: 227-235.