| GISdevelopment.net ---> AARS ---> ACRS 2000 ---> Water Resources |
Integrated Ground Water
Resources Mapping in Gurgaon District, (Haryana) India using Remote
Sensing and GIS Techniques
B. V. M. Rao Toleti, B. S.
Chaudhary, K. E. Mothi Kumar, G. P. Saroha,
Manoj Yadav, Ajeet Singh, M. P. Sharma, A. C. Pandey and P. K. Singh
Scientists, Haryana State Remote Sensing Application Centre
(Deptt. of Sci. & Tech., Govt. of Haryana)
CCS HAU Campus, Hisar 125 004, Haryana, India
Phone (01662) 31045-47, 32632; Fax 25958
Email: harsac@vsnl.net.in
Manoj Yadav, Ajeet Singh, M. P. Sharma, A. C. Pandey and P. K. Singh
Scientists, Haryana State Remote Sensing Application Centre
(Deptt. of Sci. & Tech., Govt. of Haryana)
CCS HAU Campus, Hisar 125 004, Haryana, India
Phone (01662) 31045-47, 32632; Fax 25958
Email: harsac@vsnl.net.in
Key Words :
Hydrogeomorphology, Ground Water Resources, Integration, Remote Sensing, Geographical Information Systems (GIS)
Abstract :
This paper mainly deals with the preparation of Integrated Ground Water Resource (IGWR) map indicating ground water prospects, quality and depth. Indian Remote Sensing Satellite (IRS-1C) geocoded false colour composites of Gurgaon district have been used for preparation of hydrogeomorphological map. The northern part of the district is occupied with quaternary alluvium and southern and south eastern part is occupied by precambrian metasediments of Delhi systems. The land form of this district is formed by fluvial, structural and denudational origins. The main hydrogeomorphic units mapped are alluvial plain, alluvial plain with sand cover, valley fills, interrmontane valley/basin, structural hills, residual hills, buried pediments, linear ridges along with lineaments. Each geomorphic unit is assessed for probable ground water potentiality. Depth to water table and well location data has been collected form Ground Water Cell, Department of Agriculture, Haryana. The prepared hydrogeomorphology, ground water quality and depth maps have been digitized in Arc/Info GIS environment. In order to provide more useful information on ground water resources, the authors have developed a methodology on integrated ground water resource map on 1:50,000 scale using remote sensing and conventional data in GIS environment. The IGWR map thus prepared gives information on ground water potential, quality and depth to water level at any given location. This information is very useful in narrowing down the target areas for siting bore wells. This will result in significant saving of time and cost.
1. Introduction
Water is the most vital requirement for mankind. Ground water constitutes a major portion of the earths water circulatory system known as hydrologic cycle. Ground water occurs in permeable geologic formation known as aquifer, i.e. formation having structure that can store and transmit water at rates fast enough to supply reasonable amounts to wells. In recent years much progress has been made in the application of remote sensing techniques to ground water. Exploration procedures can ideally adopt remote sensing as the first step to be followed by field geological studies, geophysical prospecting and test drilling. This helps in concentrating the field efforts in areas where greater potential exists and eliminating other zones, thus reducing the cost and time involved in exploration procedures. The advent of Geographical Information Systems (GIS) has added new vistas in the field of ground water resources mapping and management. It helps in the integrating remotely sensed derived data with ancillary data to have more precise and correct information about various factors involved in the ground water resources management. Studies are being targeted in this direction by many authors (Prakash 1993, Roy & Ray 1993, Chaudhary et al 1996 and Ravindran & Jeyram 1997). Present study emphasize on getting the information on ground water prospects, depth and quality from the prepared IGWR map.
2. Objectives
- To prepare hydrogeomorphological maps on 1:50,0000 scale using satellite data.
- To delineate ground water potential zones by assessing the hydrogeomorphic units on 1:50,000 scale.
- Preparation of integrated ground water resources map derived from hydrogeomorphology, ground water quality and depth to water level maps.
3. Study Area
3.1 Location and Extent
The Gurgaon district is one of the southern districts of Haryana. The district lies between 270 39' to 280 32' North latitude and 760 39' to 770 20' East longitude. On its north are the district of Rohtak and the Union territory of Delhi, on its east Faridabad district. Its south the district shares boundary with the state of UP and Rajasthan. On its west lies the district of Rewari and the state of Rajasthan. The total area of the district is 2716 sq. kms. Gurgaon town is situated only 32 kms south west of New Delhi, the capital city of India. The district has sub-tropical, continental monsoon climate. The normal annual rain fall in the district is 553 mm. Temperature starts rising in March. The mean daily maximum temperature is about 41o C in the months of May and June.
3.2 Physiography and Drainage
The district comprises of hills on the one hand and depressions on the other, forming irregular and diverse nature of topography. Two ridges: Firojpur Jhirka - Delhi ridge forms the western boundary and Delhi ridge forms the eastern boundary of the district. These hills are northern continuation of Aravalli hills. The northwestern part of the district is covered with sand dunes lying in the westerly direction due to south western winds. The extension of the Aravalli hills and the presence of sand dunes collectively form the diverse physiography of the district. The drainage of the district are typical of arid and semiarid areas. It comprises of large depressions and seasonal streams. Important depressions of the district are Khalilpur lake, Chandani lake, Sangel - Ujhina lake, Kotla dhar lake and Najafgarh lake. Sahibi and Indrani are two important seasonal streams of the district.
3.3 Geology and Soils
Gurgaon district is occupied by quaternary alluvium and precambrian meta-sediments of Delhi System. The geological formations of Gurgaon district have been extensively studied by R. Chakrapani (1981). Delhi super group is represented by Alwar quartizites, mica schists and pegmatite intrusives of the Alwar series and slates of phyllites and quartzites of the subrecent alluvium and sand dunes. Stratigraphic succession of the area is given in table 1. The soils are sand to loamy sand in sandy plain areas. Sandy loam to clay loam/silty clay loam in alluvial plains, loam sand to loam, calcareous in salt affected plains; silty loam to loam in low lands and loamy sand to loam, calcareous in hills. Taxonomically these soils may be classified as Typic Ustipsamments, Typic Ustorthents, Typic/Udic/Aquic Ustochrepts, Typic Haplaquepts and skeletal/Lithic Ustorthents
4. Database
4.1 Remote Sensing Data:
IRS-1C geocoded standard False Color Composite (FCC), a combination of three spectral bands 2,3 and 4 on 1:50,000 scale have been used in the above study. IRS 1C path row 95/51, 96/50 and 96/51 covers the study area. March/ October 1996 data have been used in the above study.
4.2 Survey of India (SOI) toposheets
The following toposheets on 1:50,000 scale are used in the preparation of base maps onto which the interpretation details are transferred. The district is covered by 12 toposheets numbered- 53D/11, 14, 15, 16; 53H/2, 3, 5; 54A/13, 14 and 54E/1, 2, 5.
4.3 Ancillary Data
The meteorological data, Statistical abstracts, Census handbook, available ground water literature etc. Ground water depth and quality data have been collected from Ground Water Cell, Agriculture Department, Govt. of Haryana.
5. Methodology
The water on the surface which has a bearing on ground water circulation under ground can be distinguished in the near infrared region owing to low reflection of water. Synoptic view, repetitive coverage and capability to view the scene in several spectral bands, some lying beyond the visible part of the electromagnetic spectrum, are some of the special characteristics that have made remote sensing an effective tool in ground water search. The clue to ground water search is the basis that subsurface geologic elements forming aquifers have almost invariably surface expressions which can be discerned by remote sensing techniques. Visual interpretation of IRS 1C LISS-III FCC has been carried out by taking in to consideration various image and terrain elements by using a light table. Significant hydrogeomorphic units have been demarcated based on tone, texture, shape, size, pattern, association, etc. Delineation of all linear features have been carried out and with available information, classification of these linear features in to fractures, faults, shear zones, straight lithocontacts has been attempted. Delineation of hydrogeomorphologically significant land forms like valley fills, alluvial fans, piedmont zones, alluvial plains, braided channels, abandoned channels, palaeochannels, flood plain etc. has been carried out in the area covered by unconsolidated sediments. All the delineated hydrogeomorphic landforms are suffixed with lithology type i.e. RD(q) Residual hills quartzitic. Interpreted maps have been modified by taking into consideration the ground observations. Hydrogeomorphological maps thus prepared has been digitized in Arc/ Info GIS Version 7.1. Ground water depth and quality data have also been digitized . After digitisation, error removal and attributation, groundwater prospects and quality maps have been integrated to prepare ground water prospective zones map. The digitized ground water depth map has been draped on this integrated map thus resulting in to IGWR Map.
6. Results and Discussion
The details of various geomorphic units and their ground water bearing prospects are given in Table 1.
| Geomorphic Units | Water Prospects | |
| Fluvial origin Alluvial Plain |
Gently undulating plains consisting of clay, silt, fine to coarse sand of varying lithology with extensive | Excellent |
| Alluvial Plain with Sand cover | Undulating plains comprising sand, silt and clay. Sand is dominant but stabilized. | Good |
| Palaeo Channel/Abonded channel | Channels which are cut off from main course of the river which are buried or abonded. Comprises of fluvial deposits. (sand, silt and clay particles) | Very Good |
| Denudational origin Pediment | Occurring near to structural hills gently slopping area comprising colluvial material and medium to fine grained sand and silt This unit has higher thickness near ridges and laterally merge with alluvial plain. | Moderate to good |
| Intermontane Valley/Basin | Depression between mountains, formed as broad basin consisting of colluvial deposits covered with alluvium. | Excellent |
| Valley Fill | Unconsolidated material coarse to fine sand, silt and clay. | Good |
| Residual hills | Isolated low relief hill formed due to differential weathering consisting of metasediments. | Poor |
| Structural origin Structural Hills | Structurally controlled steep sides hills associated with folds, faults, fractures and joints these are meta sediments of Delhi super group | Poor to Moderate (moderate along fault planes) |
| Linear Ridges | Long narrow low lying linear to arcuate hills rising from alluvial plains acting as barriers of ground water flow. | Poor |
Ground water quality map has three categories i.e. good ( EC varies from 0-2000 micro Mhos); moderate ( EC varies from 2000 - 4000 micro Mhos) and poor (EC > 4000 micro Mhos). The digitized Quality map has been integrated with ground water prospects map and an integrated map has been prepared. The integrated map has eight categories. Table 2 (on next page) shows different categories and the area covered by these units.
The IGWR map prepared after the integration of this map with the ground water quality map and draping of depth to water level information various zones have been identified which are shown in Figure 1.
| Sr. no. | Units Prospects (Quality) | Area (sq. kms.) | % of the total area |
| 1 | Excellent (Good quality) | 965.77 | 35.56 |
| 2 | Good (Good quality) | 190.18 | 7 |
| 3 | Moderate (Good quality) | 104.77 | 3.89 |
| 4 | Poor (Good quality) | 44.88 | 1.65 |
| 5 | Excellent (Moderate quality) | 217.3 | 8 |
| 6 | Good (Moderate quality) | 78.1 | 2.92 |
| 7 | Moderate (Moderate quality) | 9.64 | 0.35 |
| 8 | Excellent /Good/Moderate/ Poor ( Poor quality) | 1,105.36 | 40.63 |
| Total | 2,716 | 100 |
7. Advantages
The main advantages in using remote sensing and GIS techniques for ground water exploration are : Quick and inexpensive technique for getting information on the occurrence of ground water, aids to select promising areas for further ground water exploration thus reducing field work and provides information on prospects, depth and quality in one map. This type of information is very helpful in the areas where more emphasis is on ground water for the irrigation and drinking purposes such as southern part of Haryana.
8. Conclusion
Use of Remote Sensing and GIS technology is very useful for the preparation of ground water prospective areas mapping & management plan on a scientific basis. The information generated on prospects, quality and depth in a single map will help the planners and decision makers for devising sound and feasible ground water development plans.
9. Acknowledgements
Authors are thankful to Dr. S. Mohan Chief Scientist, Haryana State Remote Sensing Application Centre (HARSAC), Hisar for giving ideas and making corrections in the final version of the paper. It has improved a lot due to his constructive criticism and valuable suggestions.
10. Selected Bibliography
- Chakrapany, R.A.1981. Hydrogeology of Gurgaon District, Haryana, Central Ground Water Board, Ministry of Irrigation, Govt. of India, pp. 43 - 51.
- Chaudhary, B. S.; Kumar, M.; Roy, A.K. and Ruhal D.S. 1996. Application of Remote sensing and Geographic Information Systems in Ground water Investigations in Sohna block, Gurgaon District, Haryana (India). In: International Archives of Photogrammetry and Remote Sensing Vienna, Vol. XXXI, Part B6, pp.18-23.
- Prakash, S.R. 1993. Identification of ground water prospective zones by using remote sensing and geo-electrical methods in and around Saidnagar area, Dakar Block, Jalaun district, U.P., Indian Society of Remote Sensing 21(4): 217-227.
- Ravindran, K.V. and Jeyram A.,1997. Ground water prospects of Shahbad tehsil, Baran district and Eastern Rajasthan: A remote sensing approach. Indian Society of Remote Sensing 25(4): 239-246.
- Roy, A.K.; and Ray P.K.C., 1993. Ground water investigation using remote sensing and GIS techniques- A case study in Manabazar-II, Purulia (W.B.). Proceedings National Symposium of North-Eastern region, Guwahati, India pp. 180-184.
- District Gazetteer, 1991, District Gurgaon, Haryana.
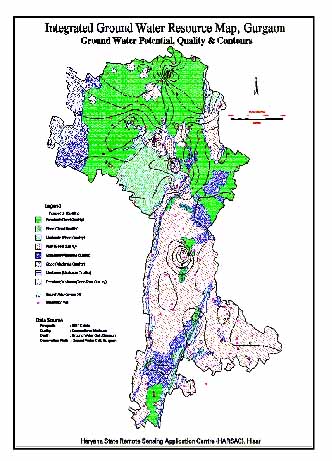
Figure 1. Integrated Ground Water Resources Map