| GISdevelopment.net ---> AARS ---> ACRS 2000 ---> Image Processing |
Self-Organizing Feature Map
for Multi-Spectral Spot Land Cover Classification
Jen-Hon Luo, Lecturer and PH. D Candidate
Department of Electronic Engineering, Ming-Hsin Institute of Technology
1 Hsin-Hsing Road Hsin-Fong, Hsin-Chu, Taiwan
Tel:+(886) 3-4227151 ext. 7864
e-mail:jhluo@ip.csie.ncu.edu.tw
Din-Chang Tseng
Professor
Institute of Computer Science and Information Engineering,
National Central University, Chungli, Taiwan
Keywords: Texture, Self-Organizing Feature Map (SOFM), Learning Vector Quantization (LVQ) network, Land Cover Classification.
Abstract
Most of the remote sensing images have the so-called texture patterns. This makes texture feature extraction and classification techniques play important roles in the remote sensing image processing. Traditional statistical classification methods suffer from the assumption that the probability distribution must be normal distribution in practice. Recently, many non-parametric neural networks have been successfully used in the field of remote sensing classification. We apply a new category classification method to SPOT scene land cover classification. This is a three-stage mechanism. First, use a spatial filter for multi-spectral feature extraction. Secondly, employ a supervised non-parametric self-organizing feature map (SOFM) for pattern similarity learning, then a Learning Vector Quantization (LVQ) network with the trained SOFM as its hidden layer is used to classify the land covers. From experimental results, we can see that the proposed method obtains superior results compared to traditional maximum likelihood (MLH) and other methods.
Introduction
With the growing number of remote sensing imagery and the extensive use of the geographic databases, there is a need to develop tools for efficient extraction of information, and intelligent search and manipulation of the image database. Therefore, the potential use of the accumulated images can be fully realized. The required techniques include feature extraction, segmentation, and classification. That most of the remote sensing senses have the so-called texture patterns makes texture feature extraction, segmentation, and classification techniques play pivotal roles in the field of remote sensing image processing.
The classification method consists of two types: supervised and unsupervised. The maximum likelihood (MLH) (Andrews, 1972) method has often been applied to category classification of remote sensing data as the supervised classification method and has very good results in many applications. In practice, the discrimination function of MLH method works under the assumption that the probability distribution for each category is an n-dimensional normal distribution where n denotes the number of spectral bands. However, the probability distribution of real data for each category does not always follow a normal distribution that is essential to a conventional MLH method.
Therefore, a non-parametric classification method, neural networks, becomes important for real data processing. The network architectures and signal processes used to model neural systems can roughly be divided into three categories: feed-forward networks, feedback networks, and self-organizing networks.
1. Feed-forward networks transform sets of input signals into sets of output signals. The desired input output transformation is usually determined by external, supervised adjustment of the system parameters.
2. In feedback networks, the output information defines the initial activity state of a feedback system, and after state transitions the asymptote final state is identified as the outcome of the computation.
3. In the third category, neighboring cells in a neural network compare in their activities by means of mutual lateral interactions, and develop adaptively into specific detectors of different signal patterns. In this category, learning is called competitive, unsupervised, or self-organizing map.
In this article, a window mask is used to extract texture pattern features, and a self-organizing feature maps (SOFM) is proposed to learn the pattern similarity in the feature space, then a Learning Vector Quantization (LVQ) network with the trained SOFM as its hidden layer is used to classified the test images.
Self-Organizing Feature Map (SOFM)
SOFM based on competitive learning is a topology-preserving map (Kohonen, 1982, 84), and can be adjusted to approach the probability distribution of the inputs (Zheng, 1996). In a topology-preserving map, neurons located physically next to each other will respond to input vectors of classes that are likewise next to each other. By this method, large-dimensional input vectors can project down on the two-dimensional map in a way that still maintains the natural order of the input vectors.
1. The SOFM Learning Algorithm
During the training period, each neuron with a positive activity within the neighborhood of the winning neuron participates in the learning process. A winning processing element is determined for each input vector based on the similarity between the input vector and the weight vector.
Let us denote the input vector, X, as follow:
The weight vector, Wj , corresponding to output layer neuron j can be written:
The winning neuron can be determined by
, the index c refers to the winning neuron.
If c is the winning neuron, Nc(t) is the list of neuron indices that make up the neighborhood. Nc(t) is a decreasing function of discrete time (i.e., iteration). It means the size of the neighborhood is decreased as training iterations go on. Then, the weight-update equations are:
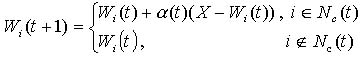 (4)
(4) Experiments and Results
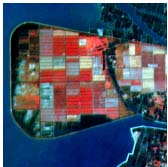
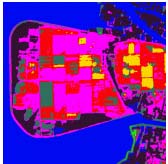
The study site, Tung-shih farm, is located at E/N (159000, 2602950) as left up corner, and (164000,2597950) as right down corner. It is an experimental farm belonging to Taiwan Sugar Corporation. The 3-band (G, R, and IR) SPOT image over the study area was received on 1994, at the receiving station of the Center for Space and remote Sensing research at the NCU campus and was further processed to produce a geocoded image on a 2°TM coordinate system. Fig. 1(a) shows the pseudo color image md¥(composed by SPOT XS3, XS2, and XS1 as R, G, and B.) of the size 400 x 400 pixels of the test site covering approximately 5km x 5km. The field is divided into 400 meters by 100 meters square blocks. As an experimental farm, it maintains complete records m for land truth reference. These two reasons make the farm an ideal place for image processing test site.
We take the three bands value of each pixel (xs1, xs2, xs3) as the spectral feature vector of each pixel, and (md(i,j), dd(i,j), bd(i,j) as the spatial feature vector of pixel p(i,j) where md(i,j) is the mean, dd(i,j) is the standard deviation, and bd(i,j) is the difference between the maximum and minimum values of the pixels in a window of size 2d+1 and centered at (i, j).
(a) |
(b) |
(c) |
(d) |
(e) | |
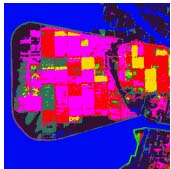
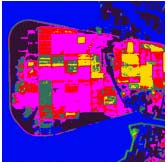
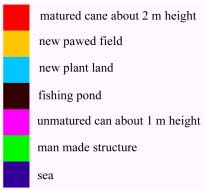
Fig. 1(a) SPOT pseudo color image (copyright@CNES 1996), (b) MLC classified image using spectral information only, (c) MLC classified image using (m, s, b) spatial information, (d) SOM classified image using (m, s, b) spatial information, and (e) the color coding map for classification results.
Fig. 3(b) is the classified image of (a) by MLC method uses spectral information as feature vectors, Fig. 3(c) is the classified image of (a) by MLC method uses spatial information as feature vectors, and Fig. 3(d) is the classified image of (a) by SOFM method uses spatial information as feature vectors. Fig. 3(e) is the color coding map for classification results.
Table 1. MLC classification matrix uses spectral features only, table 2. MLC classification matrix uses spatial features, and table 3. SOM classification matrix uses spatial features.
| Class | 1 | 2 | 3 | 4 | 5 | 6 | 7 | Producer's purity (%) |
| 1 | 2312 | 2 | 23 | 0 | 163 | 0 | 0 | 92.5 |
| 2 | 16 | 2141 | 6 | 0 | 282 | 55 | 0 | 85.6 |
| 3 | 30 | 10 | 2116 | 0 | 309 | 35 | 0 | 84.6 |
| 4 | 50 | 0 | 59 | 2070 | 0 | 0 | 321 | 82.8 |
| 5 | 302 | 214 | 405 | 0 | 1503 | 76 | 0 | 60.1 |
| 6 | 0 | 24 | 115 | 0 | 87 | 2274 | 0 | 91 |
| 7 | 6 | 0 | 18 | 37 | 0 | 0 | 2439 | 97.6 |
| User's purity (%) | 85.1 | 89.5 | 77.2 | 98.2 | 64.2 | 93.2 | 88.4 |
Overall purity=84.9%, K coefficient=0.824
| Class | 1 | 2 | 3 | 4 | 5 | 6 | 7 | Producer's purity (%) |
| 1 | 2322 | 0 | 0 | 0 | 178 | 0 | 0 | 92.9 |
| 2 | 0 | 2347 | 0 | 0 | 138 | 15 | 0 | 93.9 |
| 3 | 6 | 0 | 1760 | 0 | 662 | 73 | 5 | 74.4 |
| 4 | 64 | 0 | 3 | 2366 | 41 | 0 | 26 | 94.6 |
| 5 | 63 | 2 | 176 | 0 | 2254 | 5 | 0 | 90.1 |
| 6 | 0 | 68 | 37 | 0 | 132 | 2263 | 0 | 90.5 |
| 7 | 49 | 0 | 24 | 0 | 75 | 0 | 2352 | 94.1 |
| User's purity (%) | 93 | 97.1 | 88.3 | 100 | 64.8 | 96.1 | 98.7 |
Overall purity=90%, K coefficient=0.88
Table 3 SOM classification matrix using spatial features.
| Class | 1 | 2 | 3 | 4 | 5 | 6 | 7 | Producer's purity (%) |
| 1 | 2348 | 0 | 0 | 0 | 152 | 0 | 0 | 93.9 |
| 2 | 8 | 2408 | 25 | 0 | 59 | 0 | 0 | 96.3 |
| 3 | 18 | 0 | 2361 | 0 | 121 | 0 | 0 | 94.4 |
| 4 | 75 | 0 | 21 | 2378 | 3 | 0 | 23 | 95.1 |
| 5 | 75 | 3 | 215 | 0 | 2207 | 0 | 0 | 88.3 |
| 6 | 3 | 47 | 110 | 0 | 45 | 2295 | 0 | 91.8 |
| 7 | 148 | 0 | 34 | 0 | 0 | 0 | 2310 | 92.4 |
| User's purity (%) | 87.8 | 98 | 85.4 | 99.7 | 85.3 | 100 | 99.0 |
Overall purity=93.2%, K coefficient=0.921
A large variety of back-propagation methods are used to train the networks. The convergence of a learning process is sensitive to the selection of a training data set, and the learning method often requires a large number of iterations and much computational time. The method is a black box approach that is difficult to give physical meaning to weights connecting the neurons. The utility of the SOFM lies mainly in its fairly rapid convergence, it can capture the probability distribution of the inputs, and it is easy to interpret. From the experiments, it gets pretty good results compared to other methods.
Reference
- Andrews, H. C., 1972. Introduction to Mathematical Techniques in Pattern Recognition. Wiley, N. Y.
- Kohonen, T., 1982. Self-organized formation of topologically correct feature maps. Biol. Cybern., vol. 43, pp. 59-69.
- Kohonen, Teuvo, 1984. Self-Organization and Associative Memory. volume 8 of Springer Series in Information Sciences, Springer, New York, pp. 184-189.
- Zheng,Yi and Greenleaf, James F, 1996. The effect of concave and convex weight adjustments on self-organizing Maps. IEEE Trans. Neural Networks, vol. 7, no. 1, pp. 87-96.