Verification of INSAR
Capability for Disaster Monitoring - A Case Study on Chi-Chi Earthquake in
Taiwan Shoji
Takeuchi1, Yuzo Suga1, and Yoshinari
Oguro2 1Professor,
2Assistant-professor Hiroshima Institute of
Technology, 2-1-1,Miyake,Saeki-ku,Hiroshima 731-5193,Japan Tel
&Fax :(81)-82-922-5204 E-mail: sh-take@cc.it-hiroshima.ac.jpA.
J. ChenProfessor Center for Space and Remote Sensing
Research, National Central University of
Taiwan Chung-Li,Taiwan Chinatsu
YonezawaResearcher Remote Sensing Technology Center of
Japan Roppongi First Bldg.,1-9-9,Roppongi,Minato-ku Tokyo
106-0032,Japan
Key Words
ERS/SAR, SAR
interferometry, Chi-chi Earthquake, Coherence,Land
displacement
Abstract
The authors conducted a
verification study on the capability of interferometric SAR (InSAR)
technology for monitoring damages by Chi-chi earthquake occurred on
Sep.21,1999 in Central Taiwan by using ERS-2/SAR data received at Center
for Space and Remote Sensing Research (CSRSR). The items for verification
are detection of damaged urban areas by building collapses, detection of
land-slide areas, and extraction of land displacement patterns caused by
the earthquake. We obtained positive results for supporting high
capability of InSAR for detecting damaged urban areas and for extracting
land displacement patterns in flat or semi-flat areas around Taichung
city. On the other hand, for detecting landslide areas, InSAR did not work
because of poor coherence of interferograms in mountainous regions by
repeat-pass ERS-2/SAR data pairs, while SAR backscattering intensity by
ERS-2/SAR was partly available for detecting land slide areas. Above
results verified that InSAR by ERS/SAR is effectively used for disaster
monitoring in urban or agricultural areas with flat or semi-flat
topography, although InSAR is difficult to be used practically in steep
mountainous areas with dense vegetation.
Introduction
On
21st of September in 1999 at 1:47 a.m. local time, a Ms=7.7 earthquake
shook the central area of Taiwan. The epicenter was 160 km south-west of
Taipei, the capital of Taiwan and near a small town Chi-Chi. This is the
largest earthquake on the Taiwan island in the 20th century, which caused
2470 fatalities, 11,305 injuries, 53,551 buildings totally collapsed, and
53,633 half collapsed. The total capital lost is estimated to be US $:11.8
billions. In addition, as the results of the earthquake, wide spread
landslides occurred in Central Taiwan.
Center for Space and
Remote Sensing Research (CSRSR), which has been receiving SPOT data and
SAR data from ERS-2 and RADARSAT operationally, started the intensive
reception of SPOT data just after the earthquake, and analyzed these SPOT
data to detect land slide areas as early as possible and to monitor their
temporal changes (Chen and Wang,2000).In this study, the authors studied
the applicability of another data source,ERS-2/SAR data received at CSRSR,
for monitoring damages or environmental changes caused by the earthquake.
Currently the interferometric SAR (InSAR)technology has been one of the
important and effective approaches using SAR data for disaster or
environmental monitoring. Therefore, we attempted to conduct three kinds
of interferometric analyses, the detection of the damaged urban areas
using coherence information, the extraction of land displacement patterns
using two-pass differential interferometry, and the detection of landslide
areas in mountainous regions using coherence and intensity.
Test
Site, Data and Processing
The test site is located at the central
area of Taiwan. Figure 1 shows ERS-2/SAR intensity image of the test site
acquired on Sep.23,1999.The left-half areas of the image are almost flat
or semi-flat areas including some urban areas, the biggest of them is
Taichung City located in the upper part of the image. The right-half areas
are rather steep mountainous areas, where big geometric distortions of SAR
data are recognized due to foreshortening effect brought by ground height
and a small incidence angle of ERS/SAR. The epicenter is indicated by a
cross located in the lower-right part of the image.
Four
repeat-pass ERS-2/SAR data acquired on Jan. 21,May 6,Sep.23 and Oct.28 in
1999 were used as the test data. For interferometric processing, four data
pairs were used as shown in Table 1.The table also shows nominal values of
the perpendicular baseline component for each pair. The second and third
data pair (pair-2 and pair-3)includes the earthquake occurrence between
the times of observation, while pair-1 was acquired before the
earthquake,pair-4 after the earthquake, and both pairs do not include the
earthquake occurrence.
Table 1.Data pairs of ERS/SAR
for interferometric analysis
(I: Include the earthquake, N: Not
include)
| Data pair |
Data combination |
Baseline
(perp.comp.)
|
I or N |
| Pair-1 |
Jan.21 -May 6,1999 |
96 m |
N |
| Pair-2 |
May 6 -Sep.23,1999 |
213 m |
I |
| Pair-3 |
Jan.21 -Sep.23,1999 |
309 m |
I |
| Pair-4 |
Sep.23 -Oct.28,1999 |
224 m |
N |
These
SAR data were processed from signal data to generate multi-look intensity
images, coherence images and differential interferograms using 3dSAR
processor developed by Vexcel Corporation in U.S.A. The size for
multi-look was 2 range pixels by 10 azimuth lines, which resolution was
about 40 by 40 meters on the ground. The coherence images were generated
by computing the complex correlation coefficient in a small corresponding
patch using the two single-look complex (SLC) images registered each other
as follows;
Coherence = 
where C1 and C2 are complex
values for the first and the second data,*means complex conjugate and
E()means the expectation in the corresponding patch.The size of the
corresponding patch was 2 pixels by 10 lines, which was the same as the
pixel size after multi-look processing.
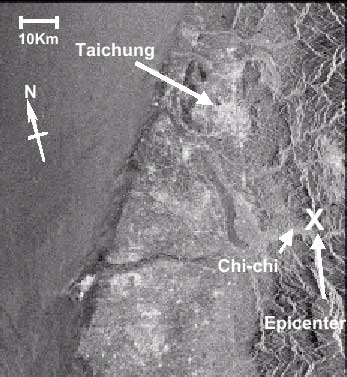
Fig.1.ERS-2/SAR intensity image (Sep.23,1999).(©ESA/ERS
1999)
The differential interferograms were generated by a
rather complicated procedure,in which orbital fringes and topographic
fringes are removed almost perfectly from the initial interferograms
generated by computing phase differences between two SLC data which were
co-registered each other precisely.The topographic fringes were removed by
subtracting the simulated topographic fringes using a digital elevation
model (DEM)with 100 m by 100 m pixel spacing from the real
interferograms.
Detection of Damaged Urban Areas Using Coherence
Information
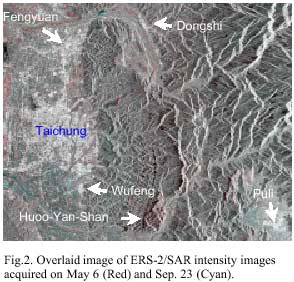
Figure 2 shows an example of the overlaid images of two
ERS-2/SAR multi-look intensity images acquired on May 6 and Sep.23,with
the color assignment of red for the former and cyan for the latter. The
test site is the surrounding area of Taichung City. From this image, it is
almost difficult to interpret the intensity changes due to the earthquake
occurrence in all urban areas located inside the image. By the report for
the survey of urban damages, the urban areas in Dongshi, Puli and Wufeng
located inside the image were damaged severely (Kokusai Kogyo
Co.LTD.,1999).Especially in Dongshi and Puli, more than 50 percent of the
buildings in the central urban areas were collapsed.
 |
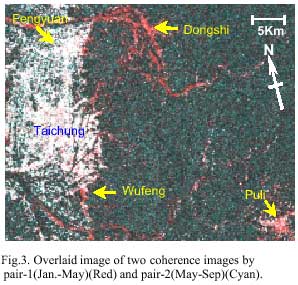 |
Figure 3 shows the overlaid image of two coherence images, which were
obtained from the data pair-1 and pair-2 respectively. Red color was
assigned to the coherence by pair-1 and cyan was assigned to the coherence
by pair-2.It is clearly indicated in Figure 3 that the urban areas in
Dongshi, Puli and Wufeng are colored as red, which means that the
coherence by pair-2 significantly decreased compared with that by
pair-1.On the other hand, in Taichung and Fengyuen there hardly seen red
colors inside the urban areas. By the report, the central urban areas in
these two cities were not damaged seriously by the earthquake, although
point-wise damages were seen in some small parts of those sub-urban
areas.
From the two figures described above, the effectiveness of
the coherence information compared to the intensity information for damage
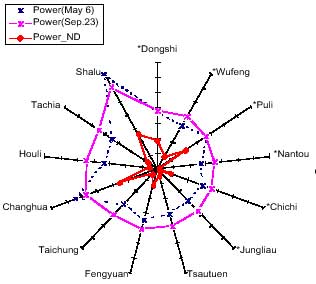
detection in urban areas is definitely clear. We evaluated the changes of
intensity and coherence by the normalized difference of two power data and
two coherence data respectively. They are defined as follows;
 |
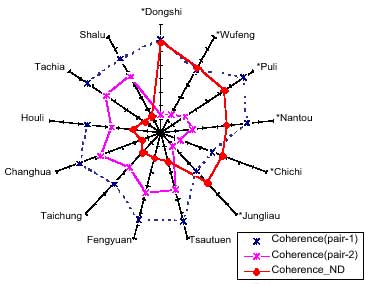 |
All the power data were normalized by the maximum power value among all
the data in the two dates. The left and right graphs in Figure 4 show the
results of the evaluation of the changes in the intensity and the
coherence respectively in some sample urban areas in Taichung and Nantou
Prefecture. The group from Dongshi to Jungliau in the right side (attached
*)is the group for severely damaged urban areas and the group from
Tsautuen to Shalu in the left side is the group for non-damaged or slightl
y damaged urban areas. For Taichung City, the data of three sample areas
were averaged. In the left graph in Figure 4,any significant separation is
not seen between the damaged urban group and non-damaged urban group by
Power_ND. On the other hand, in the right graph, two groups are clearly
separated by Coherence_ND.
We also attempted to detect the
damaged urban areas using SPOT panchromatic images acquired before the
earthquake (on Feb.9,1999)and after the earthquake (on Sep.27,1999).
However, in the SPOT image, it was quite difficult to interpret the image
differences between damaged and non-damaged urban areas. It was also
difficult to interpret the changes on spatial patterns because the
resolution of SPOT panchromatic data is 10 meters and this resolution is
still insufficient for detecting the changes of the shape or the size of
buildings by collapsing.
Above results by the intensity and
coherence of ERS/SAR verifies that the coherence is superior to the
intensity as the parameter for detecting damaged urban areas by building
collapse. In addition, these damaged areas are difficult to detect even by
comparing two SPOT panchromatic images acquired before and after the
earthquake. These facts are considered due to higher sensitivity of the
coherence to ground surface changes compared with the intensity of SAR
backscatter or reflection of sun light. This high sensitivity is
considered to be brought by the fact that the coherence is significantly
affected by phase variation and the spatial scale generating phase
variation is the order of wavelength of microwave and much smaller than
the ground resolution of ERS/SAR or SPOT panchromatic data.
 |
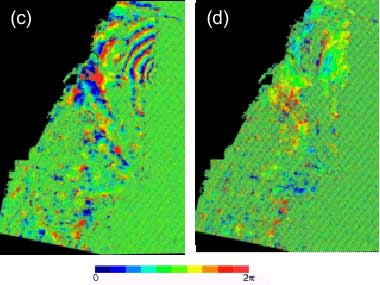 |
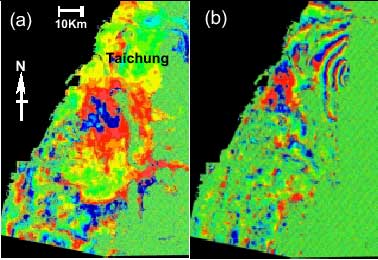
Fig.5.Differential interferograms obtained by ERS/SAR.
(a) Pair-1
(Jan.21 - May 6, 1999).
(b) Pair-2 (May 6 - Sep.23, 1999).
(c)
Pair-3 (Jan.21 - Sep.23, 1999).
(d) Phase difference patterns between
(b) and (c).
Extraction of Land Displacement by Differential
Interferogram
We attempted to generate differential interferograms from
the first three pairs indicated in Table 1.Figure 5 (a),(b),and (c)shows
all of the obtained differential interferograms. The phase patterns in
these interferograms indicate the phase differences due to land
displacement in the slant range direction under the assumption that the
phase patterns caused by orbit difference (orbital fringes)and topography
(topographic fringes)are removed perfectly. For the confirmation of
removal of both fringes, the phase patterns (a)by pair-1 is a key result,
because this pair does not include the earthquake occurrence and so it is
hardly possible to get the phase patterns due to land displacement. In
fact, the phase patterns in the interferogram by pair -1 are almost flat,
which supports that both fringes are almost completely removed. Another
important key is the consistency of the phase patterns between the results
from different data combinations. This consistency can be investigated by
subtracting the interferogram by pair-2 from that by pair -3.The result is
shown in Figure 5 (d).The phase patter ns in the interferogram (d) are
also almost f lat and consistent with those by pair-1,which interval
corresponds to the difference of the intervals by pair-3 and
pair-2.
The investigation described above on all of the obtained
intergerograms clearly supports that the differential interferometry by
ERS/SAR succeeded to extract the phase patterns relat ed to the land
displacement caused by Chi-chi earthquake.owever,the usable phase patterns
are only available in flat or semi-flat areas.In mountainous areas,the
interferograms are almost noisy and they can not bring any information
about land displacement.This result clearly comes from poor coherence by
ERS/SAR inter- ferometry in mountainous areas as pointed out in the
beginning of this section.Therefore the application of differential
interferometry by ERS/SAR is actually limited to the areas where
topography is flat or semi-flat and the vegetation cover is relatively
less like urban or agricultural areas.
Fig.4 Results of
evaluation of SAR intensity changes (left)and coherence changes (right)due
to the earthquake in the sample urban areas in Taichung and Nantou
Prefectures (except Changhua).(*denotes severely damaged urban
group).
Fig.6.Displacement patterns obtained from the differential
interferoframs in Figure 5.
[(a):Pair-1,(b):Pair-2,(c):Pair-3
]
From the above results, the land displacement patterns due to
Chi-chi earthquake are possible to extract from the differential
interferograms shown in Figure 5.The amount of displacement in a slant
range direction is a half of the wavelength (a half of 5.6 cm for ERS/SAR)
for one cycle of phase patterns. The direction of the displacement is
toward satellite if the phase values decrease toward satellite, and
backward satellite if the phase values increases toward satellite. As all
test ERS/SAR data were acquired in a descending orbit, he radar signals
were illuminated from the right side of the images. In the interferograms
of Figure 5 (b)and (c),as the phase decreases in the right direction,
namely toward satellite, the directions of the displacement are all toward
satellite if the left-side edge portion (actually the coastal line of the
left part of the images)does not move.
Figure 6 (a),(b)and (c)show
the displacement patterns obtained from the three differential
interferograms in Figure 5 (a),(b)and (c)respectively.As the amount of
displacement is only computed in the areas where phase unwrappi ng was
succeeded,the displacement patterns were not obtained in almost of
mountainous areas where the coherence was very poor and so the
displacement fringes could be hardly obtained.In addition,the displacement
patterns in Figure 6 were computed as the relative displacement inside the
whole areas where phase unwrappi ng was succeeded because the displacement
is possible to compute only from the relative changes of phase
patterns.
As the displacement values in Figure 6 indicate the
displacement in a slant range direction, it is necessary to convert the
displacement values to those in a vertical or a horizontal direction,
although it is impossible to decide either vertical or horizontal only by
the interferograms. The conversion is done by the multiplication of the
inverse of cos denotes incidence angle of SAR)for a vertical displacement
and sin for a horizontal displacement respectively. As is approximately 23
deg. for ERS/SAR, the multiplication factor is 1.09 for a vertical and
2.56 for a horizontal direction respectively. As the maximum relative
displacement value seen in Figure 6 (b)and (c)is about 22 cm in a slant
range, the maximum displacement value is about 24 cm for a vertical and
about 56 cm for a horizontal direction. As the result of the comparison
between the displacement patterns in Figure 6 and those by GPS observation
(Nat ional Cheng-Kung Univ.,1999),the displacement patterns by SAR were
proved to be fairly compatible to those by GPS in both of direction and
amount.
Detection of Landslide Areas Using Coherence and
Intensity
We also attempted to detect landslide areas in
mountainous regions caused by the earthquake using the change of coherence
and intensity. For the extraction of coherence changes, the coherence
images by pair-1 and pair-4 were compared each other. The reason why these
two pairs were used was that there might be some possibility for coherence
increase in landslide areas after the earthquake because forest vegetation
was almost lost due to the landslide. However, the result was that
coherence by pair-4 (after the earthquake)was extremely low in mountainous
regions and still same as that by pair-1 (before the earthquake).This
result indicates some limitation of InSAR by C-band SAR in steep
mountainous regions. On the other hand, it was found that the intensity by
SAR multi-look images partly decreased in landslide areas after the
earthquake. Therefore, some of the landslide areas were possible to be
detected using these intensity changes, although the landslide areas in
the slopes facing to radar illumination were hardly detected due to a big
foreshortening effect in ERS-2/SAR images. This result indicates that
backscattering intensity is partly available to detect landslide areas
even in mountainous regions.
Conclusion
As the
first result of this study, the coherence information was proved to be an
effective parameter to detect damaged urban areas by the earthquake, which
has been also verified by another case study for The 1999 Great
anshin-Awaji Earthquake (Yonezawa and Takeuchi,1999).The consistency
between the two case studies seems quite important and valuable because it
clearly enhances that SAR observation in which a good interferometreic
condition is maintained is significantly important for disaster monitoring
by SAR data.The second result suggested that differential interferometry
by ERS/SAR is possibly effective to extract land displacement by an
earthquake together with some limitation. In flat or semi-flat areas where
main land covers are occupied by urban or agricultural lands, the
differential interferogframs obtained by ERS/SAR brought reasonable
displacement information caused by the earthquake. The third result
suggested an essential limitation of C-band InSAR in steep mountainous
regions. The first two successful results clearly enhance the importance
of interferometric SAR for disaster or environmental monitoring using
space-borne SAR data.
References
Chen A.J.and Chien Ying
Wang.2000.Using SPOT I mageri es to Monitor Landslides in Chi-chi
earthquake.Pr esented At I nter national Wor kshop 2000 in I T on Gener
ation of Advanced Earth Environmental Information.
Kokusai Kogyo
Co.,LTD.1999.Record of Great Taiwan Earthquake on September 21,1999 (in
Japanese).
National Cheng-Kung University.1999.Satellite
Geoinformatics Research Center,921 Chi-chi earthquake damaged area
satellite control points displacement
map,http://www.sgrc.ncku.edu.tw,
Yonezawa,C.and
S.Takeuchi.1999.Detection of Urban Damage Using Interferometric SAR
Decorrelation.Proceeding of IGARSS'99,pp925-927.
|