| GISdevelopment.net ---> AARS ---> ACRS 2000 ---> Poster Session 3 |
Volcano Hazard Management
Using Digital Elevation Model
1D.John
Prabaharan and 2Kasturi Devi Kanniah
1School of Spatial Science, Curtin University of Technology,
Perth, W.Australia - 6845
E-mail: jdp27@yahoo.com
2Department of Remote Sensing
Faculty of Engineering and Geoinformation Science
Universiti Teknologi Malaysia, 81310 Skudai
Johor, Malaysia
E-mail: kdk21@yahoo.com
Keywords : GIS, DEM, mudflow, flow path,
velocity, discharge rate, traveling time. 1School of Spatial Science, Curtin University of Technology,
Perth, W.Australia - 6845
E-mail: jdp27@yahoo.com
2Department of Remote Sensing
Faculty of Engineering and Geoinformation Science
Universiti Teknologi Malaysia, 81310 Skudai
Johor, Malaysia
E-mail: kdk21@yahoo.com
Abstract
GIS is being recognized as having applications for volcanic hazard assessment in early 90's. In this study digital terrain model within GIS environment was used to model the mudflow in Kawah Ijen volcano, Indonesia. With 36 million m3 of acidic water in its crater lake, Kawah Ijen is recognized as a potential threat to the surrounding population and properties. Using DTM, which was created by interpolating contours, two major mudflow paths were identified. Even a minor mudflow originated from the lake will flow through these paths. The topographic characteristics such as flow path's bed slope, width and depth were used to estimate the velocity and quantity of mudflow. The Manning formula with coefficient of 0.15 was used for calculating the velocity and quantity of mudflow.
Introduction
Volcanoes generate a wide variety of phenomena that can alter the earth's surface and atmosphere and endanger people and property. During the past 15 years volcanic activity killed more than 29000 people, forced over 830000 to flee from their homes and caused economic losses in excess of $3 billion (Simkin and Siebert, 1994). Countries like Indonesia which lies at the junction of three major plates with a population of 150 million face the greatest overall threat (Suryo et al, 1985). Most volcanoes related to deaths are associated with highly explosive eruptions involving pyroclastic flows and mudflows.
A flow composed of relatively small rock particles dominantly sand and silt size particles (less than 2 millimeters in diameter) are often called as mudflow. Mudflows have sediment concentration as great as debris flows and their sediment composition typically consists of at least 50% sand; silt and clay sized particles. Mudflows contain high concentration of rock debris to give them the internal strength necessary to transport huge boulders as well as buildings and bridges and to exert extremely high impact forces against objects in their paths (USGS, 1998).
Among the factors cause mudflow hazards, eruption through volcanic crater lakes represent a unique hazard because of the danger posed by the storage of large volume of water in proximity to near surface magma bodies the degree of hazard is proportional to the volume of water in the lake. This study is related to this category of mudflows. Eruptions in crater lake settings can result in deadly mudflows as seen at Mt. Ruapehu (New Zealand), Mt. Kelut (Indonesia) and etc (Oppenheimer, 1993). The most frequent reason for lake breakouts is the overflow of lake water across the dam and subsequent erosion and rapid down cutting into the loose volcanic rocks.
Since the impact posed by mudflow hazards is severe, it is vital to monitor, improve or lessen the impacts by utilizing GIS. Modeling the path of mudflow is fundamental to understand the areas affected by mudflow. The contribution of GIS in mudflow disaster ranges from identifying areas at risk, monitoring and forecasting hazards, to warning the possibly affected people or responsible teams to take precautions. All these strategies can be performed by utilizing the input, data analysis, modeling and display capability of GIS. This study was carried out by digitizing and interpolating the contours of Kawah Ijen area to create a DEM. Subsequently the DEM was used to identify the major mudflow paths that would carry the mud to the surrounding areas in a GIS environment. The velocity and quantity of mudflow from the crater lake was also estimated using hydraulic models.
Study Area
In this study, Kawah Ijen crater lake was selected because it is one of the largest and most active lakes that contain huge quantity of water. Any eruption through this lake would expel the water and create deadly mudflow that can claim hundreds of lives and properties (Oppenheimer, 1993). It contains about 36 million cubic meters of steaming, sulphurous acidic water. The floor is covered completely by a warm lake with the temperature ranges from 27 - 42°C. The outlet of the crater lake is located in western side that becomes the upper course of Banyupait - Banyuputih rivers. The size of the crater is about 960m x 600 m and has the surface area of 41x104 m2 and 200 m deep. Kawah Ijen is placed on the summit of Mt. Ijen which is located in east Java. Ijen is one of the active volcanoes situated towards the eastern side of Ijen caldera The location of Mt. Ijen is shown in figure 1.
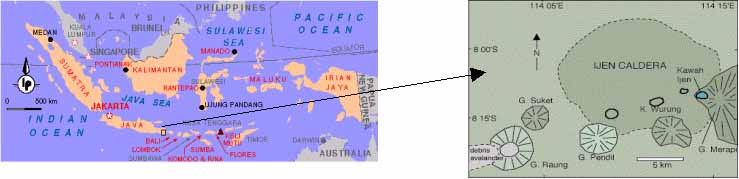
Figure 1 shows the location of Mt. Ijen in East Java, Indonesia and its aproximate outline of Ijen caldera.
(Source:http://www.lonelyplanet.com/dest/sea/graphics/map-indo.htm).
Data
For the above purposes the below data sets and methods were utilized.
- Toposheet map of Kawah Ijen area with a scale 1: 50,000 and Landsat 5 Thematic Mapper (TM) scene of Kawah Ijen dated on 5th October 1994 with World Referencing System of Path and row of 117/166.
- Arc info version 7.1 and Arc view 3.0 GIS software packages, Imagine image processing software 8.3 (all run on windows network system) and Microsoft excel.
Flow path derivation
Firstly, a DEM was created by digitizing and interpolating contour map of Kawah Ijen area (1:50,000 scale). Subsequently, the DEM was used for deriving the mudflow direction. The direction of the flow is determined by finding the steepest descent, or maximum drop from each cellThe flow direction was found by Arcinfo "flow direction" command. The next step was to find the flow path. The flow accumulation process was utilized to find the gravity driven flow path.
The flow accumulation function calculates accumulated flow as the accumulated weight of all cells flowing into each down slope cell in the output grid. Cells with a high flow accumulation are areas of concentrated flow. The flow path was identified using 'stream network' and 'connects stream' functions available in arcinfo. The important flow paths were converted into arc coverage using arcview on screen digitization facility to drape over the DEM.
Estimation of Velocity and Quantity of Mudflow
In hydraulic flow routing the equation of motion for an open channel mudflow are
where, x - the longitudinal distance along the meandering channel, t - time, A - wet cross sectional area, y - flow depth, V - average velocity (over cross - sectional wetted area), Q - the Quantity of discharge (=VA), Sx- channel slope (Sx = tan q = bed slope), Sf - Term which takes into account energy dissipation.
For the case with zero lateral inflow, the friction slope is
where, Sf - Slope friction, S - Bed slope, ¶y/¶x - Surface slope of flow materials, V/g ¶V/¶x - Convective acceleration, 1/g ¶V/¶t -Temporal acceleration.
The kinematic wave method assumes that the inertia terms of Eq.(2) are negligible and that the friction equals the bed slope S. Momentum conservation is approximated by assuming steady uniform flow, and routing is accomplished by combining the continuity equation. Typically either the manning or Chezy equation is used to find the velocity. The Chezy (3) and Manning (4) equations are:
V=(1.486/n) R2/3 S1/2 (4)
where C and n are friction coefficients, S is the friction slope, and R is the hydraulic radius (area divided by wetted perimeter). Both give velocity in meters per second if area and wetted perimeters are input using square meter and meter units. The applicability of the manning formula to hyper concentrated flows has been used successfully by Laenen and Hansen (1988), Takahashi (1985), Public Work Research Institute(1988) and Vignaux and Weir (1990).
The channel geometry (flow depth and width, cross sectional area, wetted perimeter, hydraulic radius and slope) was calculated using the DEM. In nature, the flow paths do not have a perfect shape of triangular or trapezoidal. Therefore, in this study each cross-section was examined carefully and assumed to fit either to triangular, trapezoidal, circular or rectangular shape. The most appropriate formulae were selected in accordance to the channel shape for calculating the area (A), wetted perimeter (P), hydraulic radius (R) and top width (B).
The Manning coefficient of n can be predicted using Strickler equation. The Strickler equation to predict n is
where, D - is the median grain size (m).
The mudflow grain size assumed is 2 mm (USGS1998). The calculated n is 0.15 (This co-efficient is well agree with the viscous co-efficient of lahar found by Macedonio et al (1992) for muddy flow and by Costa (1997) for hydraulic modeling for lahar hazard study at Cascades volcanoes. The velocity and quantity of discharge are calculated for various flow depths using manning formula in the Microsoft excel.
Results and Discussion
Mudflow path
Analysis of flow path and visualization of the terrain will lead to the understanding of the mudflow origin and flow direction of the mud. This is shown in Figure 2 where two major mudflow paths were derived from DEM. Mudflow is most likely to flow on the west and Northwest of Kawah Ijen volcanic flank. Flow path A (Banyoeputih river) originates from Ijen Crater's outlet and flows towards the west of the volcano flank. It passes West of Mt. Blade and crosses in between Blawan- Kidoel and Kaligedang areas. Pelanggan and Blawan settlements that are located in Blawan Kidoel area are in proximity to the major mudflow route. Thus, any mudflow hazard from Kawah Ijen would affect the people and properties of these settlements. Whilst, flow path B starts from the Northeast of Ijen volcano's flank and in proximity to Blaoe settlement that is located approximately 0.25 km from this flow path. This shows that the mudflow hazard originated from Kawah Ijen would seriously affect this settlement area. The flow path crosses the Kaligedang area and flows into Sengon River. In accordance to the satellite image of this area, there are valuable natural forest and horticulture plantations like tea and coffee in Blawan Kidoel and Kaligedang areas. Obviously, these resources would be destroyed by vigorously moving mudflow. These two major mudflow paths identified from DEM are also exactly coinciding with the mudflow hazard map prepared by volcano survey team of Indonesia in 1990 (Sumberdaya, 1990).
Quantitative analysis of mudflow
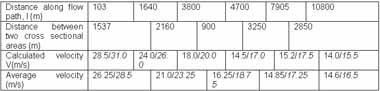
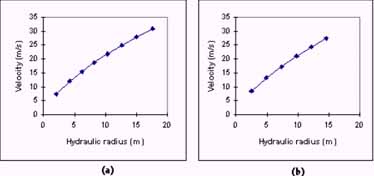
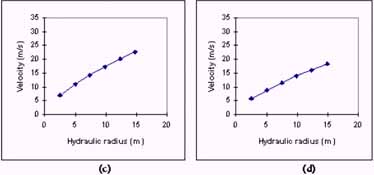
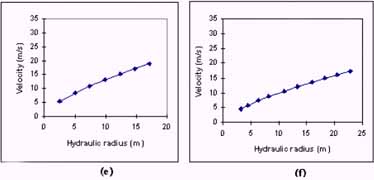
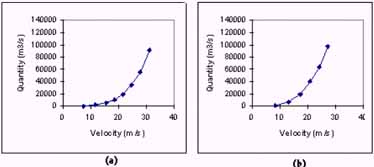
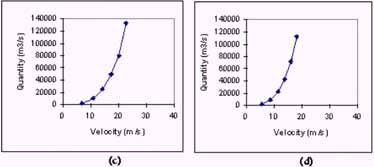
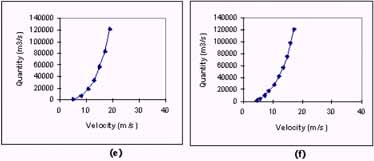
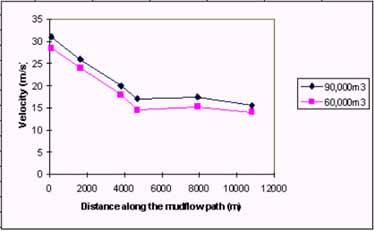
Wholesale ejection of lake water (36 million m3) would not be expected in on go. However, even a fraction of water that rushes through the outlet is capable of creating mudflow. The hydraulic radius and velocity depict a linear relationship where the increase in the hydraulic radius (which is a function of flow path cross sectional area and wetted perimeter) is accompanied by a steady increase in the velocity. This is shown in figure 3i (a-f). For example at the distance of 4.7 km from the Crater Lake (figure 3id) the mudflow achieves a velocity of 16 m/s when the hydraulic radius extent to 12.4 m. Meanwhile, the relationship between discharge rate and the velocity of mudflow reveals that as the quantity of discharge increases the velocity also increases in a non- linear fashion (Figure 3ii (a-f)) For example near to the outlet, when the discharge rate increases from 20,000m3/s, 60,000 m3/s and 90,000 m3/s the mudflow travels rapidly at a velocity of 22 m/s to 28.5m/s and 31 m/s respectively. The higher rate of velocity near the outlet could be due to the steep slope at the volcanic flank. It is gradually decreasing when mudflow approaching the downhill side, mainly due to the slope of the topography. At the distance of 4700m the velocity of mudflow is comparatively lower because the flow path's width is wider than that of other areas. The velocity of mudflow is mainly depending upon the characteristics of topography such as slope and the quantity of discharge of water from the Crater Lake (figure 3(iii)).
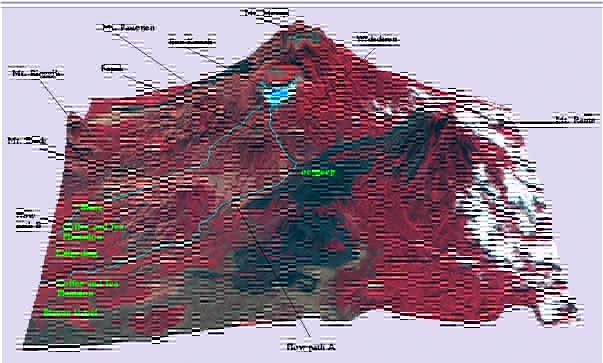
Figure 2 shows the major mud flow paths. Flow paths and Landsat TM image (RGB:4 3 2) overlaid onto DEM to visualise the flow path in a 3D perspective view.
(i)
(ii)
(iii)
Figure 5 (i) to (f) Shows the relationship between the hydraulic radius and the velocity of mudflow at several areas along the flow path at various distances, Surface Profile a) in outlet area, 0.103 km distant from the crater lake, b) 1.64 km, c) 3.8 km, d) 4.7 km, e) 7.95 km, f) 10.8 km from the crater lake. Figure 5 (ii) shows the relationship between discharge rate and velocity of the mudflow at several cross sectional areas along the major mudflow path. Surface profile (a) nearer (0.103km) to the outlet of Kawah Ijen Crater Lake. (b) 1.64 km, (c) 3.8 km, (d) 4.7 km, e) 7.95 km. (f) at 10.8 km from the Crater Lake. Figure 5 (iii) shows the velocity of mudflow along the flow path.
Conclusion
Mudflow modeling of Ijen kawah volcano using DEM within a GIS environment is found to be useful in providing information pertinent to mudflow hazard. The velocity of the mudflow is directly proportional to the cross-sectional area of the flow path, hydraulic radius and bed slope of flow path and inversely proportional to the wetted area perimeter. Meanwhile, as the quantity of water discharge from the Crater Lake increases the velocity of mudflow also increases. Information pertinent to the routes of flows can provide precautionary measurement against mudflow hazards. In mudflow analysis, collecting more field data, improving DEM's grid element size and coupling GIS with hydraulic flow model can improve the mudflow model.
References
- COSTA.J.E, 1997, Hydraulic Modeling for Mudflow hazards at Cascades volcanos, Environmental and Engineering Geoscience, 3.1, pp 21-30.
- http://www.lonelyplanet.com/dest/sea/graphics/map-indo.htm
- JONES A.C., 1995., Improvement of volcanic hazards assessment tecques using GIS: a case study of Mount Etna, Sicily, Innovation in GIS2, Taylor and Francies.
- LAENEN A AND HANSEN., 1988., Simulation of three lahars in the Mount St. Helens area, Washington, Using a One- Dimentional, Unsteady stream flow model.,USGS, Water Resources Invest. Rep. 88 - 4004, pp 20 .
- MACEDONIO.G, PARESCHI.M.T., 1992., Numerical Simulation of some Mudflows from Mt. St. Helens, Journal of Volcanology and Geothermal Research, 54. 1-2, pp 65-80.
- OPPENHEIMER, C., 1993, Infrared surveillance of crater lakes using satellite data. Journal of Volcanology and Geothermal Research, 55 117-128.
- Public WorksResearch Institute., 1988., Technical Standard for measures against debrisflow, Technical memorandum PWRI 2632, Ministry of construction, Japan, 40p.
- SIMKIN, T., AND SIEBERT, L., 1994, Volcanoes of the World, 2nd edition:Tucson, Geoscience Press, 349p.
- SUMBERDAYA D., 1990., G.Ijen, Berkala vulkanologi edisi khusus, No.151, Departemen pertambangan danenergi, Republic Indonesia.
- SURYO. I AND CLARKE M.C.G., 1985., The occurrence and mitigation of volcanic hazards in Indonesia as exemplified at the Mount Merapi, Mount Kelut and Mount Galunggung volcanoes, Quarterly Journal of Engineering Geology .,18: 79-98.
- TAKAHASHI T., 1985., Debris flow: mechanics and hazard mitigation., Proc. ROC-Japan Joint Seminar on Multiple hazards mitigation, National Taiwan university , Taipei, pp. 1075-092.
- USGS., 1998., Hazard posed by volcanoes, http://volcanoes.usgs.gov/Hazards/What/Lahars/lahars.html.
- VIGNAUX.M; WEIR.G.J., 1990., A General Model for Mt Ruaphehu Mudflows, Bulletin of Volcanology, 52.5, 381-390.