| GISdevelopment.net ---> AARS ---> ACRS 2000 ---> Poster Session 3 |
Dynamic Simulation Of Land
Use/Cover Change Based On Time Series Satellite Images
Zhongchao Shi, Ryousuke
Shibasaki
Center for Spatial Information Science(CSIS), The University of Tokyo
4-6-1 Komaba, Meguro-ku,Tokyo 153-8558 Japan
Tel. +81-3-5452-6413 Fax +81-3-5452-6414
shizc@skl.iis.u-tokyo.ac.jp, shiba@skl.iis.u-tokyo.ac.jp
Center for Spatial Information Science(CSIS), The University of Tokyo
4-6-1 Komaba, Meguro-ku,Tokyo 153-8558 Japan
Tel. +81-3-5452-6413 Fax +81-3-5452-6414
shizc@skl.iis.u-tokyo.ac.jp, shiba@skl.iis.u-tokyo.ac.jp
Keywords : Dynamic, Land Use/Land Cover(LUCC),
Change Detection
Abstract
Land use and land cover of the earth are changing dramatically because of the human activities and natural disasters. To simulate the changes of land use/cover is significant for making a sustainable land use plan. In this paper, a method aiming at dynamic simulation and estimation of the land use/cover change (LUCC) is proposed, which includes following models: 1) Image classification model; 2) Data transformation model; 3) Change detection model.
1. Introduction
Land use and land cover of the earth are changing dramatically because of the human activities and natural disasters. In many areas, people are suffering from the deforestation, flooding, food shortage, green house affect, urban extension etc. Most of these environmental problems are related to LUCC changes. It is then important to master the LUCC change in order to make a sustainable global land use plan.
In 1993, the first LUCC/CPPC (Land use/Cover/Core Project Planning Committee) conference was held in Spain, which is a sign of international collaborative research in LUCC. In 1996, LUCC Open Science Meeting was held in Holland and the international LUCC project was started after that.
Satellite images have played an important role in LUCC project and LUCC change detection. Up to now, NOAA AVHRR time series images have been widely used for LUCC research because of their low cost. But, for the purpose of regional LUCC research, 1km resolution is insufficient. In our research, time series MSS and TM images are used for LUCC change detection. Many case studies have been carried out. But because of the page limitation, only two typical areas of our experimental results will be shown in this paper.
2. Study Areas
China was selected for the case study because the LUCC of some areas of China changed a lot in the past three decades. As shown in Fig. 1, two places were selected in this paper. One is located in Inner Mongolia (Grassland) while another is close to Pearl River (Urban Extansion) in Guangdong province. Three images (1 MSS in 70's and two TMs in 80's and 90's respectively) for each area were utilized for the analysis (see Table 1).
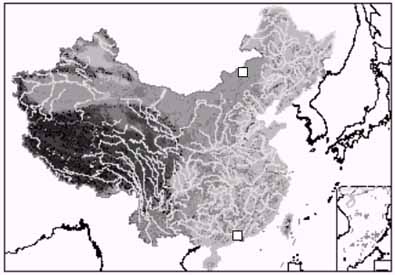
Fig.1 Study areas
Table 1. Image data
3. Methodology
Authors have proposed an arable land use change model in 1999. In this paper, we introduce a method, which can detect the changes of different type of the geo-objects. The procedures of the processing are:
Several case studies have been carried out according to the method introduced in former Chapter. We would like to show two of them because of the page limitation in this paper. Fig.2 shows three images used in Inner Mongolia. Fig.3 and Fig. 4 show the classification results and detected grassland changes, respectively.
Fig.2 Three images of Inner Mongolia
(a) Classification Result of MSS(1973)
(b) Classification Result of TM(1987)
(c) Classification Result of MSS(1973)
Fig.3 Classification results in Inner Mongolia area
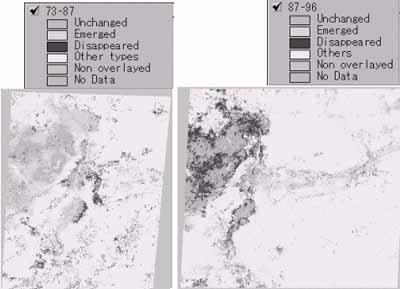
Fig.4 Detected grassland changes in Inner Mongolia area
Fig.5 shows three images used in Pearl River area. Fig.6 and Fig. 7 show the classification results and detected change of urbanization in that area, respectively.
Fig.5 Three images of Pearl River area
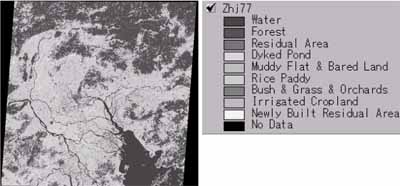
(a) Classification Result of MSS(1977)
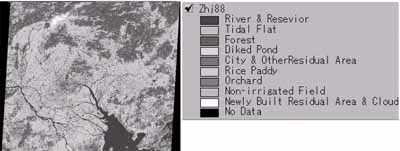
(b) Classification Result of TM(1988)
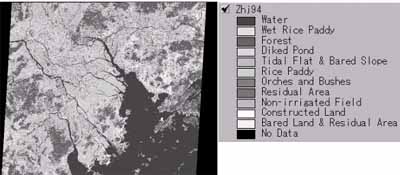
(c) Classification Result of TM (1994)
Fig.6 Classification results in Pearl River area
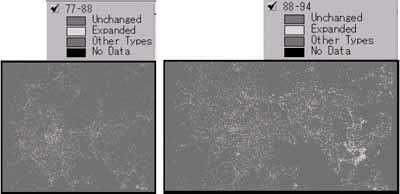
Fig.7 Detected urbanization regions in Pearl River area
5. Conclusions
In this paper, a method respect to LUCC change detection based upon time series Landsat images was introduced. By using time series Landsat images, the LUCC changes can be detected accurately. The LUCC change information is very important for decision making of sustainable land use planning in both national and regional levels.
6. References
Abstract
Land use and land cover of the earth are changing dramatically because of the human activities and natural disasters. To simulate the changes of land use/cover is significant for making a sustainable land use plan. In this paper, a method aiming at dynamic simulation and estimation of the land use/cover change (LUCC) is proposed, which includes following models: 1) Image classification model; 2) Data transformation model; 3) Change detection model.
1. Introduction
Land use and land cover of the earth are changing dramatically because of the human activities and natural disasters. In many areas, people are suffering from the deforestation, flooding, food shortage, green house affect, urban extension etc. Most of these environmental problems are related to LUCC changes. It is then important to master the LUCC change in order to make a sustainable global land use plan.
In 1993, the first LUCC/CPPC (Land use/Cover/Core Project Planning Committee) conference was held in Spain, which is a sign of international collaborative research in LUCC. In 1996, LUCC Open Science Meeting was held in Holland and the international LUCC project was started after that.
Satellite images have played an important role in LUCC project and LUCC change detection. Up to now, NOAA AVHRR time series images have been widely used for LUCC research because of their low cost. But, for the purpose of regional LUCC research, 1km resolution is insufficient. In our research, time series MSS and TM images are used for LUCC change detection. Many case studies have been carried out. But because of the page limitation, only two typical areas of our experimental results will be shown in this paper.
2. Study Areas
China was selected for the case study because the LUCC of some areas of China changed a lot in the past three decades. As shown in Fig. 1, two places were selected in this paper. One is located in Inner Mongolia (Grassland) while another is close to Pearl River (Urban Extansion) in Guangdong province. Three images (1 MSS in 70's and two TMs in 80's and 90's respectively) for each area were utilized for the analysis (see Table 1).
Fig.1 Study areas
| Area | Path/Row | Date (mm/dd/yy) |
Sensor |
| Inner Mongolia | 134/029 | 11/04/1973 | Landsat MSS |
| 124/029 | 07/30/1987 | Landsat TM | |
| 124/029 | 09/25/1996 | Landsat TM | |
| Pearl River | 131/044 | 02/10/1977 | Landsat MSS |
| 122/044 | 12/10/1988 | Landsat TM | |
| 122/044 | 10/29/1994 | Landsat TM |
Table 1. Image data
3. Methodology
Authors have proposed an arable land use change model in 1999. In this paper, we introduce a method, which can detect the changes of different type of the geo-objects. The procedures of the processing are:
- Image classification. Maximum likelihood method integrated with NDVI and principle component analysis is mainly used in this model. A quantity of ground survey data is used for correcting and verifying the classification results.
- Data transformation. This model is developed for high-quality overlapping of time series images for the purpose of change detection. In this research, since Landsat MSS and TM taken at different time were utilized, we have to adjust these images into one coordinate system and unify their resolution.
- Change detection model. In different area, the major land use/cover types are different. For example, in Inner Mongolia, the grassland is the major LUCC type while in Pearl River region, there are a lot of cities, villages etc. We choose the major types of LUCC and find their changes in different research areas.
Several case studies have been carried out according to the method introduced in former Chapter. We would like to show two of them because of the page limitation in this paper. Fig.2 shows three images used in Inner Mongolia. Fig.3 and Fig. 4 show the classification results and detected grassland changes, respectively.
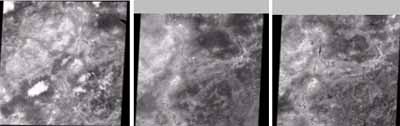 | ||
| (a) MSS image(1973) | (b) TM image(1987) | (c) TM image(1996) |
Fig.2 Three images of Inner Mongolia
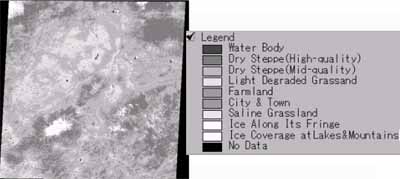
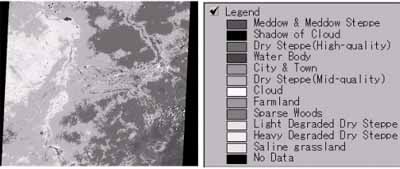
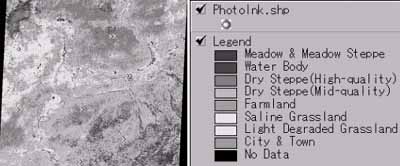
(a) Classification Result of MSS(1973)
(b) Classification Result of TM(1987)
(c) Classification Result of MSS(1973)
Fig.3 Classification results in Inner Mongolia area
Fig.4 Detected grassland changes in Inner Mongolia area
Fig.5 shows three images used in Pearl River area. Fig.6 and Fig. 7 show the classification results and detected change of urbanization in that area, respectively.
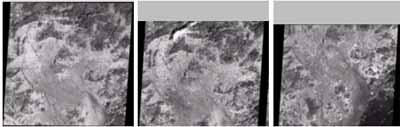 | ||
| (b) MSS image(1977) | (b)TM image(1988) | (c)TM image(1994) |
Fig.5 Three images of Pearl River area
(a) Classification Result of MSS(1977)
(b) Classification Result of TM(1988)
(c) Classification Result of TM (1994)
Fig.6 Classification results in Pearl River area
Fig.7 Detected urbanization regions in Pearl River area
5. Conclusions
In this paper, a method respect to LUCC change detection based upon time series Landsat images was introduced. By using time series Landsat images, the LUCC changes can be detected accurately. The LUCC change information is very important for decision making of sustainable land use planning in both national and regional levels.
6. References
- Z.C. Shi, H. Liu, R. Shibasaki, "A Practical Model For Estimating The Arable Land Change Of China Using Remotely Sensed Imagery," Proc. of ACRS'99, Nov. 1999, HongKong, pp. 753-758.