| GISdevelopment.net ---> AARS ---> ACRS 2000 ---> Poster Session 3 |
Use of Landsat Images for the
Identification of Damage Due to the 1999 Kocaeli, Turkey Earthquake
Miguel Estrada*, Fumio
Yamazaki**
*Graduate Student, **Associate Professor, Institute of Industrial Science,
The University of Tokyo, Bw304, 4-6-1 Komaba, Meguro-ku, Tokyo 153-8505
Tel: +81 (3) 5452-6388 Fax: +81 (3) 5452-6389
E-mail: miguel@rattle.iis.u-tokyo.ac.jp, yamazaki@iis.u-tokyo.ac.jp
Masashi Matsuoka
Chief Research Engineer, Earthquake Disaster Mitigation Research Center,
RIKEN, 2465-1 Mikiyama Miki, Hyogo 673-0433, Japan
Tel: +81 (794) 83-6632 Fax: +81 (794) 83-6695
E-mail: matsuoka@miki.riken.go.jp
Key Words*Graduate Student, **Associate Professor, Institute of Industrial Science,
The University of Tokyo, Bw304, 4-6-1 Komaba, Meguro-ku, Tokyo 153-8505
Tel: +81 (3) 5452-6388 Fax: +81 (3) 5452-6389
E-mail: miguel@rattle.iis.u-tokyo.ac.jp, yamazaki@iis.u-tokyo.ac.jp
Masashi Matsuoka
Chief Research Engineer, Earthquake Disaster Mitigation Research Center,
RIKEN, 2465-1 Mikiyama Miki, Hyogo 673-0433, Japan
Tel: +81 (794) 83-6632 Fax: +81 (794) 83-6695
E-mail: matsuoka@miki.riken.go.jp
The 1999 Kocaeli Earthquake, Building damage detection, subsidence, fire.
Abstract
In this study, remote sensing satellite images are used to identify the affected areas due to the 1999 Kocaeli, Turkey Earthquake with a magnitude of 7.4. The aim of this study is to identify the hard-hit areas in different levels of damage, sunk areas into the sea and areas affected by fire. The analysis has been carried out in two different cities, Gölcük and Adapazari, where these types of damage were seen. The data that have been used are optical remote sensing images taken by Landsat/TM satellite on March 27 and August 18, 1999, before and after the earthquake, respectively. For the detection of burned and sunk areas a spectral comparison of the Landsat/TM is carried out. In order to detect the different levels of damages in the urban areas, a comparison of the ratio between different bands of the pre- and post-event images is conducted. In addition, principal components analysis is conducted for each one of the sets of images and later compared. In order to calibrate the results of these comparisons the product images are geographically corrected and mapped, afterwards they are compared with the ground truth data that are in a GIS system.
Introduction
The identification of damage due to large earthquakes is a vital issue to grasp the level and extension of the hard-hit areas. The evaluation can be conducted through a field reconnaissance survey. Even though, the field survey has a high accuracy it requires a lot of resources and time. In the event of large natural disasters, like a destructive earthquake, a fast assessment of the damaged areas is required to send off rescue teams and help. Also the awareness of the extension of damage can help to outline recovery plans. Recently remote sensing technology has become a tool in damage identification after the occurrence of natural disasters like floods, landslides or earthquakes (e.g. Matsuoka and Yamazaki, 1999). The identification of damage from a large area gives vital information that authorities can use to plan rescue procedures as well as to draw a general idea of the magnitude of the damage. The location of different types of damage like fire outbreak, ground settlement and building damage using optical remote sensing data is considered in this study.
 In order to identify the
different kinds of damage, the comparison of optical satellite images
taken before and after the earthquake is conducted. In this study the area
around Gölcük city in Turkey has been focused. First, image-to-image
registration was carried out to match the images. To detect the fire
outbreak we compared the profiles along X-axis and Y-axis of the pre- and
post-event images. For the detection of the sunken area the histograms of
the infrared band are matched and then the result images are compared. For
the detection of different levels of damage an analysis in the visible
region is conducted as well as Principal Component Transformation
(Yasuoka, 1990). Data for the 1999 Kocaeli Earthquake are: Date: August
17th, 1999. Time: 00:01:38.56 (UTC).
In order to identify the
different kinds of damage, the comparison of optical satellite images
taken before and after the earthquake is conducted. In this study the area
around Gölcük city in Turkey has been focused. First, image-to-image
registration was carried out to match the images. To detect the fire
outbreak we compared the profiles along X-axis and Y-axis of the pre- and
post-event images. For the detection of the sunken area the histograms of
the infrared band are matched and then the result images are compared. For
the detection of different levels of damage an analysis in the visible
region is conducted as well as Principal Component Transformation
(Yasuoka, 1990). Data for the 1999 Kocaeli Earthquake are: Date: August
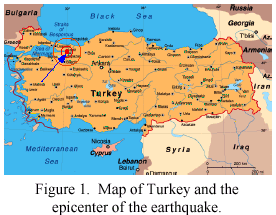
17th, 1999. Time: 00:01:38.56 (UTC). Mw = 7.4. Epicenter: Lat. = 40.639N, Long. = 29.830E (Fig. 1). Hypocentral depth: 17 km. More than 200,000 buildings were lightly to heavily damaged. More than 17,000 people were killed and almost 44,000 were injured.
Landsat/TM Image
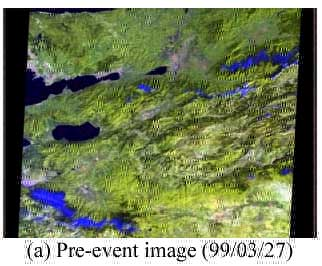
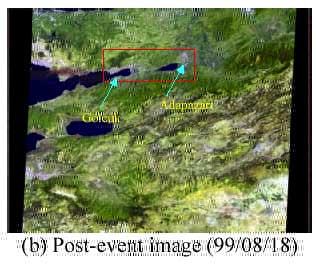
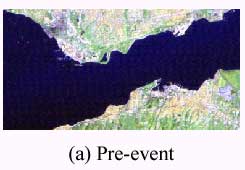
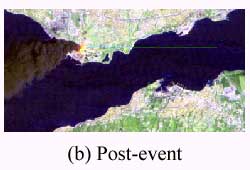
The data in this research are remote sensing images from Landsat/TM satellite taken over the affected area due to the earthquake. The images have been taken on 27 of March 1999, pre-event image, and on 18 of August 1999, for the post-event image. The composite color images of the pre-event and post-event (751) are shown in Figure 2(a) and 2(b), respectively. The images cover an area of 185 km by 154 km. Before making comparison, these two sets of images have to be registered; it means the pixels in both images must represent the same geographic location. To make an image-to-image registration one of them is chosen as a master to which the other, known as the slave, is to be registered. In this study the master image is the pre-event image and the slave image is the post-event image. The image registration has been conducted with the total area of the images and defining 250 ground control points deployed on the extension of the images. Rotation, scaling and translation method was used for warping the slave image and nearest-neighbor method was used for resampling.
Identification of Damage Caused by Fire
To identify the areas affected by fire we compare the profiles of the pre- and post-event images. The profile represents the distribution of the digital number (DN) of certain band along a strip of the image. This strip can be taken over the X-axis or Y-axis. For this comparison the band 5 (mid infrared), band 6 (far infrared or thermal band) and band 7 (mid infrared) have been used. Figure 3 shows the profiles of the DN of band 6 along the X-axis and Y-axis. Figure 1. Map of Turkey and the epicenter of the earthquake.
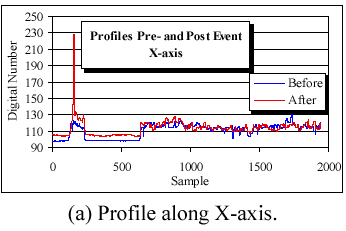
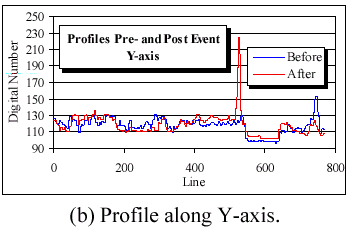
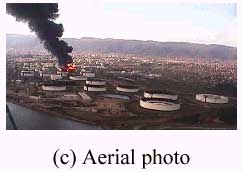
It can be observed (Figure 3) that there is a pattern in the profile before the earthquake as well in the after one. But in the region between sample 100 and sample 200, in the X-axis, and between the line 500 and 600, in the Y-axis, there are peak values, which represent the high temperature. Since the coordinates of this area are known, we can identify it in the image. This area corresponds to the Tüpras refinery, which suffered from a very large fire. Figure 4 shows the composite color image (752) as well as an aerial photo of the area around of the refinery.
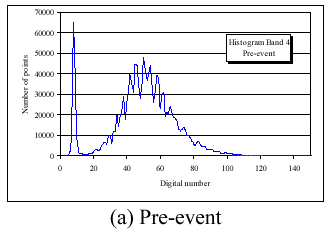
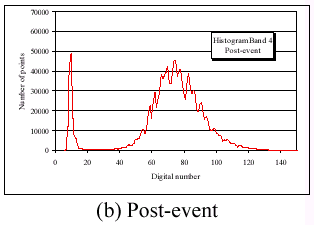
Identification of the Subsidence
Remote sensing provides a straightforward means to map the extent of water bodies, to inventory an area occupied by open water, and to monitor changes in water bodies over time. Likewise, comparisons of shoreline positions before and after flooding, permits measurement of areas flooded, as well as determination of locations of flooded areas. Such information can be difficult to acquire by conventional means. Determination of the land-water body is usually easiest in the near-infrared region, where land, especially if vegetated, is bright and open water dark. In order to detect the sunken areas we have matched the histogram of the near-infrared band (band 4). By matching the histograms of the two images (pre- and post-event) we will obtain an apparent distribution of brightness as close as possible and will minimize the brightness value variations. Since the reflectance value of the water in the near infrared band is low, we match the histograms in the range 1 to 20 and obtain the images in Fig. 6. Comparing these two images, it can be seen that in the image of the post-event (Fig. 6 (b)) there are some areas that differ from those in the pre-event image. These differences represent the inundated area. Also it is possible to calculate the extension of the flooding, by counting the number of pixels that differ between these two images. In order to count the number of pixels that belong to water body we have used the 2-D scatter diagram. In this diagram we plot the distribution of reflectance of two bands, in this case band 4 vs. band 5. We define threshold values for the reflectance of the water, based on the values of training areas of water. Finally with the threshold values we make the selection in the 2-D scatter diagram. Finally we count the number of pixels that fall into this 2-D range. The number of pixels that belong to water: Before: 8430 pixels, after: 9413 pixels, difference = 983 pixels. Total affected area (flooding) = 983 x 30 x 30 = 884,700 m 2 , that correspond to red areas in the Figure 6 (b).
Identification of Different Levels of Damage
Comparison in the Visible Range
As a first comparison for the detection and localization of damage we have conducted the comparison of the data in the visible range. For Landsat/TM satellite images bands 1, 2 and 3 cover the visible range. First we calculate de average of these first three bands by the formula:

where: BBk(i, j) is the digital number of the pixel (i, j) of the band k of the pre-event image. BRavg(i, j) is the averaged value of the pixel (i, j) of the pre-event image. This same formula is also applied to the post-event image. Then, we calculate the ratio between these two averaged images by Equation 2, where AR represents the averaged image after the event and R the ratio. Figure 7 shows the image obtained from this equation.
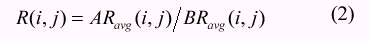
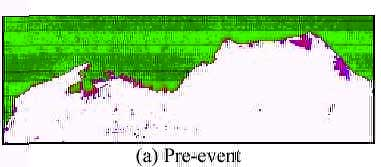
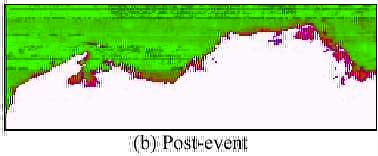
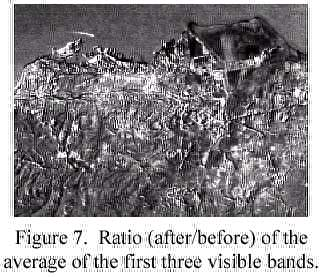
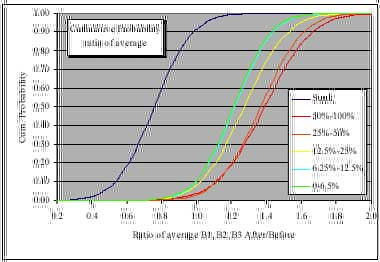
In the center of this image, the damaged area appears brighter and also the sunken area can be distinguished (in dark tones). This image is then compared with the ground truth data (AIJ, 1999) shown in Figure 8. As a result of this comparison we obtain the distribution of DN for the different levels of damage. Figure 9 shows 4 different sections: the sunken area (blue), low level damaged (green and turquoise) the section for level of damage 12.5% - 25% (yellow) and the section for high level of damage (read and orange).
Principal Component Analysis
The Principal Component Transformation is designed to reduce redundancy in multispectral data. The purpose is to compress all of the information contained in an original n-band data set into fewer n new bands or components. Let L={L1(DKN), L2(DKN)} be a combined set of 2n bands images composed of two different dates images and CL be the variance-covariance matrix of L . Each principal component Xj is expressed as:
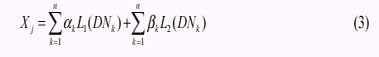
where {k, â k} is the normalized eigenvectors of the variance-covariance matrix CL of L. Difference of the surface reflectance between two dates is evaluated by the following principal component:
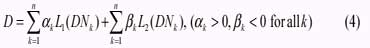
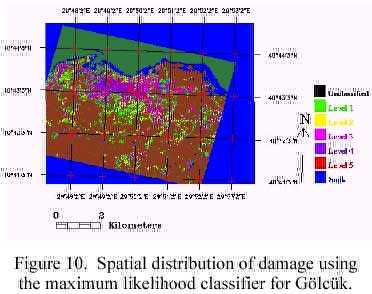
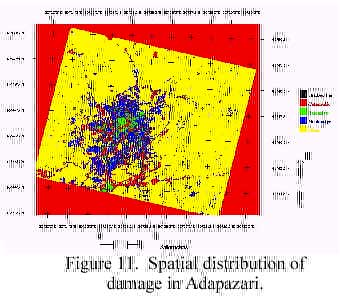
In this case, by joining the 6 non-thermal bands of the pre- and post-event images we obtain the 2n set. In this study the 3 rd principal component satisfies the condition given by Formula 4. Where the first 6 coefficients are positives and the lasts 6 are negative. It means, this principal component conveys the changes between the pre- and post-event images for this multitemporal set of images. The digital number of the pixels for the 3rd principal component image also follows the same distribution as shown in Figure 9. Based in the distribution of the digital number and using the maximum likelihood classifier we obtain the spatial distribution of the damage for Gölcük as is shown in Figure 10. This figure shows the distribution of the different levels of damage from Level 1 (no damage) up to Level 5 (high level of damage) and the sunken area. Same procedures have been conducted for Adapazari city, however, in this case the classification has been performed in only 3 levels of damage (Figure 11): no damage (blue), extensive (green) and catastrophic (red).
Conclusions
Damage detection due to The 1999 Kocaeli, Turkey earthquake was carried out using Landsat/TM images. Fire and sunken areas were successfully identified using the thermal band and the near infrared band, respectively. Different levels of building damage were recognized properly to some extent. It can be seen that the value of the digital number for the affected area increases with the increasing of damage level. This is due to the spread of debris after the earthquake. The debris has a higher reflectance in the visible region than the buildings in good condition. After using Principal Component Analysis we have found that in case of Landsat/TM images, principal component 3 conveys the changes in the multitemporal 12 non-thermal bands image.
References
- AIJ Reconnaissance Team, Kabeyasawa, T. et. al., 1999. Progress Report on Damage Investigation after Kocaeli Earthquake by Architectural Institute of Japan. Proc. ITU-IAHS International Conference on the Kocaeli Earthquake 17 August 1999.
- Campbell, J. (1996). Introduction to Remote Sensing Second Edition. The Guilford Press USA.
- Matsuoka, M. and Yamazaki, F., 1998. Characteristics of Satellite Images of Damaged Areas due to the 1995 Kobe Earthquake. 2nd Conference on the Applications of Remote Sensing and GIS for Disaster Management.
- Richards, J. and Jia, X., 1999. Remote Sensing Digital Image Analysis An Introduction Third Edition. Springer. Germany.
- Mather, P., 1999. Computer Processing of Remotely-Sensed Images An Introduction Second Edition. John Wiley & Sons. England.
- Yasuoka, Y., 1990. Digital Image Processing for Landcover Change Detection in Environmental Monitoring. National Institute for Environmental Studies. Japan.