| GISdevelopment.net ---> AARS ---> ACRS 2000 ---> Poster Session 3 |
Remote sensing of total
suspended solids in penang coastal waters, malaysia
K. Abdullah, Z. B. Din, Y.
Mahamod , R. Rainis, and M. Z. MatJafri
Universiti Sains Malaysia, 11800 Penang, Malaysia
Tel: 604-6577888 Fax: 604-6579150
E-mail: khirudd@usm.my
Keywords: algorithm, regression, total
suspended solids, Thematic Mapper Universiti Sains Malaysia, 11800 Penang, Malaysia
Tel: 604-6577888 Fax: 604-6579150
E-mail: khirudd@usm.my
Abstract
An attempt to estimate the concentration of total suspended solids (TSS) using Thematic Mapper (TM) data was carried out in the coastal waters of Penang. The algorithm used is based on the reflectance model which is a function of the inherent optical properties of water which can be related to its constituents concentrations. A multiple regression algorithm was derived using multi-band data for retrieval of the water constituent. The digital numbers coinciding with the sea truth locations were extracted and converted to radiance and exoatmospheric reflactence units. Solar angle and atmospheric corrections were performed on the data sets. These data were combined for multi-date regression analysis. The efficiency of the present algorithm versus other forms of algorithms was also investigated. Based on the observations of correlation coefficient and root-mean-square deviations with the sea-truth data, the results indicated the superiority of the proposed algorithm. The solar corrected data gave good results, and comparable accuracy was obtained with the atmospherically corrected data. The calibrated TSS algorithm was employed to generate water quality maps.
Introduction
Quantitative measurements from satellite remote sensing through analysis with coincident sea-truth data are rarely conducted in the equatorial region. The main reason for this drawback is the difficulty in obtaining cloud free scenes. In this study we attempted to use remote sensing data acquired simultaneously with the surface reference data. Thematic Mapper (TM) data were used because of the spatial resolution and availability of suitable bands for the present applications. Throughout 1999, only two TM scenes were successful acquired.
TM data have been widely used for water quality studies in coastal regions and in inland lakes (Ekstrand 1992, Ritchie et al. 1990, Baban 1993, Dekker and Peters 1993, Forster et al. 1993, Allee and Johnson 1999). To utilize the multi-spectral radiance responses detected by the sensor as a means of water quality monitoring, a model or algorithm is required to relate the TM signals to the scattering and absorption phenomena occurring within the sea.
The objectives of the study are (i) to develop remote sensing retrieval algorithms for total suspended solids (TSS) in coastal waters based on water optical model through regression with coincident sea-truth data and (ii) to perform data correction for multi-date analysis in order to establish calibrated algorithm for local applications using TM data.
Study Area and Data Acquisition
The study area is the Penang Straits which is located within latitudes 100° 15' E to 100° 25'E and longitudes 5° 15'N to 5° 30'N. The corresponding satellite track for the TM scenes is 128/56. Based on the bathymetric map the water depth within the study may reach up to about 20 m. There are two major channels within the straits, namely, the Eastern and Western channels with mean depths of about 10m and 8m respectively.
The water samples were collected from February to November 1999 on dates that the satellite was supposed to overpass the study area. Surface water samples for the determination of TSS concentration were collected using 1 liter polyethylene bottles and later analyzed in the laboratory using standard methods as proposed by Strickland and Parsons (1972). The TM scenes acquired on 2 February 1999 and 22 March 1999 were available for applications.
Water Optical Model
A physical model relating radiance from the water column and the concentrations of the water quality constituents provide the most effective way for analysing remotely sensed data for water quality studies. Reflectance is particularly dependent on inherent optical properties: the absorption coefficient and the backscattering coefficient. The irradiance reflectance just below the water surface, R(l), is given by
where l is the spectral wavelength, bb is the backscattering coefficient and a is the absorption coefficient (Kirk, 1984). The inherent optical properties are determined by the contents of the water. The contributions of the individual components to the overall properties are strictly additive (Gallegos and Correll, 1990).
For the case of two water quality components, i.e. chlorophyll, C, and suspended sediment, P, the simultaneous equations for the two channels can be expressed as
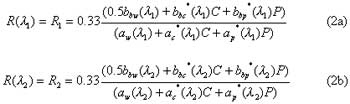
where bbw(i) is the backscattering coefficient of water, bbc*and bbp* are the specific backscattering coefficients of chlorophyll and sediment respectively, aw(i) is the absorption coefficient of water, ac*(i) and ap*(i) are the specific absorption coefficients of chlorophyll and sediment respectively (Gallie and Murtha,1992).
Regression Algorithm
Solving the above simultaneous equations for TSS concentration yields the series consisting of the terms R1 and R2
a7R1R22+a8R12R22+... (3)
where aj, j = 0, 1, 2,... are the functions of the coefficients in equation (3) which are to be determined empirically using multiple regression analysis. The algorithm can be extended to the three-band method
e7R12+e8R22+e9R32 (4)
and the coefficients ej are then empirically determined.
Analysis of TM Data
A sub-scene for each date was extracted covering an image area of 1200 pixels by 1200 pixels for analysis. The images were rectified to the corresponding map (BA Chart no. 1366) to determine their geographical coordinates by using the second order polynomial coordinate transformation. The digital numbers (DN) for bands 1, 2, and 3 at the sample stations were extracted for analysis. These DNs were then converted to radiance unit and effective at satellite reflectance. The simple solar angle correction was performed to the data sets. The atmospheric correction based on the darkest pixel method was employed in the present study (Lathrop et al. 1991, Keiner and Yan (1998), Allee and Johnson 1999).
The relationship between the sea truth reference data (TSS) and the TM bands was first examined using the combined data from both image dates for multi-date analysis. Points situated in the shallow water areas and cloud pixels were removed. The TM signals were then regressed against the suspended solid concentrations using our developed algorithm. Other forms of water quality algorithms were also tested with these data sets and their accuracies were compared with that of the proposed algorithm. For each regression model the correlation coefficient, R, and the root-mean-square deviation, RMS, were noted.
Maps of these water quality parameters were then generated using the coefficients obtained from the regression analysis of our proposed algorithm. Land and cloud areas were masked out using the threshold values of band 4 and thermal band data. The water quality images were geometrically corrected through resampling process using the nearest neighbor method. Image smoothing was performed to each map using the median filter to remove random noise while preserving high frequency features (edges). The generated maps were colour-coded for visual interpretation.
Results and Discussions
Figure 1 shows the plot of the relationship between TM signals versus TSS concentration. As the concentration increases, the response from each TM band also increases. Other investigators using remote sensing data in the visible channels for suspended sediment studies showed similar characteristics (Schiebe et al. 1992, Choubey and Subramaniam 1992). The trend suggests that the non-linear relation is preferred by the data set.
The single band method was found to be less accurate. The calibration results showed that when a single independent variable was used the polynomial form gave better accuracy than the simple linear model. The accuracy was observed to improve when higher order series were used. Generally the accuracy increased when more spectral bands and higher order series were included in the regression analysis. The proposed model used these criteria and therefore produced superior results using different sets of data transformations. Table 1 shows the comparative performance of the algorithms.
For this multi-date analysis, the use of combined raw data did not produce satisfactory results. Solar angle corrected radiance and exoatmospheric reflectance provided some improvement to the results. Figure 2 shows the regression results using the proposed algorithm for TSS using the solar angle corrected radiance data. The results suggest that the atmospheric conditions for the two scenes were nearly the same. Atmospherically corrected data did not appear to improve the accuracy. The most probable cause of the error may be the incorrect choice of the clear deep water radiance for each TM band from the two acquired scenes.
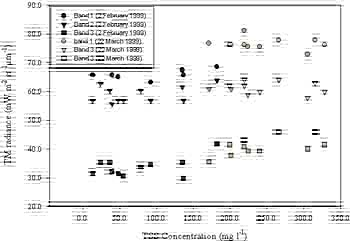
Figure 1 TM radiance versus TSS concentration.
Table 1 Regression results using different forms of algorithms for TSS and chlorophyll
| Algorithm | R | RMS (mg l-1) |
| P=ao+a1B1+a2B12+a3B13 | 0.80 | 54.91 |
| P=ao+a1B3+a2B32+a3B33 | 0.85 | 48.94 |
| P=ao+a1lnB1+a2lnB12+a3lnB13 | 0.75 | 61.09 |
| P=ao+a1lnB3+a2lnB32+a3lnB33 | 0.84 | 49.25 |
| P=ao+a1(B1/B2)+a2(B1/B2)2+a3(B1/B2)3 | 0.78 | 57.05 |
| P=ao+a1(B2/B3)+a2(B2/B3)2+a3(B2/B3)3 | 0.90 | 41.09 |
| P=ao+a1ln(B1/B2)+a2ln(B1/B2)2+a3ln(B1/B2)3 | 0.83 | 53.71 |
| P=ao+a1ln(B2/B3)+a2ln(B2/B3)2+a3ln(B2/B3)3 | 0.90 | 41.77 |
| P=a0+a1B1+a2B2+a3B1B2+a4B12+a5B22+a6B12B2+a7B1B22+a8B12B22 | 0.89 | 44.09 |
| P=a0+a1B1+a2B2+a3B3+a4B1B2+a5B1B3+a6B2B3+a7B12+a8B22+a9B32 (proposed) |
0.95 | 28.17 |
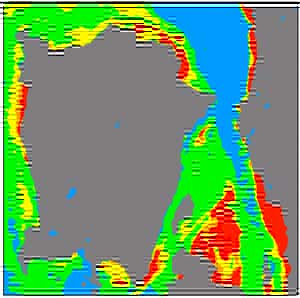
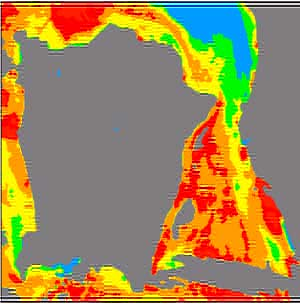
The sediment concentration patterns are consistent with the local distribution pattern (Figure 3). Higher concentration areas are distributed near the river mouths and the shallow southern region of the channel. The plumes in the river mouths were created by river discharges. In the shallow water, the turbidity might be caused by bottom resuspension due to waves and wind actions. The concentration seems to be relatively lower in the deeper part of the sea. Based on the sea truth data as well as earlier reports (Din 1995), we are quite confident of the distribution shown. However, we are unable to establish the validity of the apparent higher concentration on the west coast of Penang Island because of the absence of sea truth data. Further sea truthing for the area will be done to confirm the values. The March TSS pattern was dominated by high concentration.
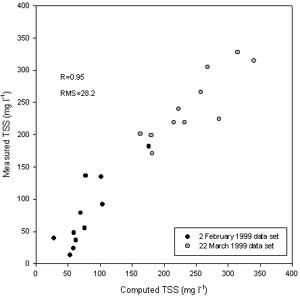
Figure 2 Regression results for TSS
 |
 |
(a) |
(b) |
| Figure 3 Distribution of TSS on (a) 2 February 1999 and (b) 22 March 1999 (colour code: blue 0-50, green 55-100, yellow 100-150,orange 150-200, red >200 mg l-1) | |
Conclusion
With the present constraints of having only two scenes, the proposed model was found to provide a useful multi-date TM water quality calibration model for the Penang Strait. The accuracy of the sea truth data played a very important role in determining the reliability of the calibrated algorithm and the quality of the generated water quality maps. The feasibility of applying the present techniques for operational use has to be further validated. Therefore more data will be required for this verification analysis.
Acknowledgements
This project was carried out using the Malaysian Government IRPA grant no.08-02-05-6011. We would like to thank the technical staff and research officer who participated in this project. Thanks are extended to MACRES and USM for support and encouragement
References
- Allee, R. J. and Johnson, J. E., 1999. Use of satellite imagery to estimate surface chlorophyll-a and Secchi disc depth of Bull Shoals, Arkansas, USA, International Journal of Remote Sensing, 20, 1057-1072.
- Baban, S. M., 1993. Detecting water quality parameters in the Norfolk Broads, U. K., using Landsat imagery. International Journal of Remote Sensing, 14: 1247-1267.
- Choubey, V. K. and Subramaniam, V., 1992. Estimation of suspended solids using Indian Remote Sensing Satellite-1A data: a case study from Central India. International Journal of Remote Sensing, 13: 1473-1486
- Dekker, A. G. and Peters, S. W. M., 1993. The use of Thematic Mapper for the analysis of eutrophic lakes: a case study in the Netherlands. International Journal of Remote Sensing, 14: 799-821.
- Din, Z. B., 1995. Environmental impact assessment study of the proposed 275kV overhead cable crossing: Juru to Bayan Lepas. Final consultancy report submitted to the Tenaga National Berhad.
- Ekstrand, S., 1992. Landsat TM based quantification of chlorophyll-a during algae blooms in coastal waters. International Journal of Remote Sensing, 13, 10, 1913-1926.
- Forster, B. C. Xingwei, I. S., and Baide, X., 1993. Remote sensing of water quality parameters using landsat TM. International Journal of Remote Sensing, 14: 2759-2771.
- Gallegos, C. L. and Correl, D. L., 1990. Modelling spectral diffuse attenuation,absorption and scattering coefficients in a turbid estuary. Limnology and Oceanography, 35, 1486-1502.
- Gallie, E. A. and Murtha, P. A., 1992. Specific absorption and backscattering spectra for suspended minerals and chlorophyll-a in Chilko Lake, British Columbia. Remote Sensing of Environment, 39, 103-118.
- Keiner, L. and Yan, X-H., 1998. A neural network model for estimating sea surface chlorophyll and sediments form Themitic Mapper imagery. Remote Sensing of Environment, 66: 153-165.
- Kirk, J. T. O., 1984. Dependence of relationship between inherent and apparent optical properties of water on solar altitude. Limnology and Oceanography, 29, 350-356.
- Lathrop, R. G., Lilliesand, T. T., and Yandel, B. S. 1991. Testing the utility of simple multi-date Thematic Mapper calibration algorithms for monitoring turbid inland waters. International Journal of Remote Sensing, 12: 2405-2063.
- Ritchie, C. J., Cooper, C. M., and Schiebe, F. R., 1990. The relationship of MSS and TM digital data with suspended sediment, chlorophyll and temperature in Moon Lake, Mississipi. Remote Sensing of environment, 33, 137-148.
- Schiebe, F. R., Harrington, J. A., and Ritchie, J. C., 1992. Remote sensing of suspended sediments: the Lake Chikot, Arkansas project. International Journal of Remote Sensing, 13: 1487-1509
- Strickland, J. D. H. and Parsons, T. R., 1972. A practical handbook of seawater analysis.