| GISdevelopment.net ---> AARS ---> ACRS 2000 ---> Poster Session 3 |
Contribution form remote
sensing in updating bathymetric chart
K. Abdullah , M. Z.
MatJafri and Z. B. Din
Universiti Sains Malaysia
11800 Penang, Malaysia
Tel: 604-6577888 Fax: 604-6579150
E-mail: khirudd@usm.my, mjafri@usm.my
Keywords : algorithm, bathymetry, remote
sensing. Universiti Sains Malaysia
11800 Penang, Malaysia
Tel: 604-6577888 Fax: 604-6579150
E-mail: khirudd@usm.my, mjafri@usm.my
Abstract
The study area selected is the Strait of Penang, located in the north western part of peninsular Malaysia. Surveys were conducted to measure new sounding points using a boat equipped with an echo sounder. The station locations were determined using a GPS system. The data were analysed and tidal corrections were applied to reduce the measured water heights to the chart datum. The tidal readings obtained from the nearest station were used for reference in the data analysis. A new suggested bathymetric chart was drawn based on the new sounding points. We attempted to employ satellite imagery as an aid to bathymetric charting. Cloud free scenes of Landsat TM and SPOT data acquired between January 1997 and February 1997 were available for use in the present study. Each subscene was rectified to the corresponding bathymetric chart. Image locations were related to map GCP coordinates through the second degree polynomial transformation equations. The pixel values at the sample locations were extracted and used as independent variables. Multiband water depth algorithm was used in the calibration analysis. Regression technique was used for calibration of the satellite signals for water depth measurement using the measured sounding points as dependent variables. The correlation coefficient and root-mean-square deviations were examined for each data set. The accuracy of each calibrated algorithm was further verified using other known sounding points. The respective calibrated algorithm was then applied to the coresponding image to generate a water depth map. The colour coded bathymetric map was used for visual interpretation and assessment of the present water depth pattern.
Introduction
Although the existing bathymetric charts were reprinted recently, they display water depth values which were measured decades ago. Oceanographers have often questioned the reliability of these charts. Costal erosion and siltation as well as activities like dredging and land reclaimation can cause deposition and erosion of the sea floor and hence changing the bottom topography. Therefore a resurvey of the present water depth pattern was conducted in an attempt to update the existing bathymetric chart.
In this present study the use of both the algorithms (using single-band, two-band ratio and three?band) and the proposed three-band methods were investigated in coastal areas of Malaysia. The aim of the study is to assess the accuracy provided by different types of satellite data in bathymetric mapping. TM and SPOT data were used in the present comparative analysis. The limitations faced by the remote sensing technique are discussed.
Physical Principles of Water Depth Determination
The development of water depth determination techniques was based on the simple water reflection model which accounts for the major part of the signal received by a sensor over a clear shallow water (Lyzenga (1978)). According to this model, the radiance, L, in a single wavelength band can be written as
where Lo is a constant which includes solar irradiance, the transmittance of the atmosphere and the water surface and the reduction of the radiance due to refraction at the water surface; Ls is the radiance observed over deep water (due to external reflection from the water surface, volume reflected radiance from the water column and scattering in the atmosphere); Rb is the bottom reflectance; K is the effective attenuation coefficient of water; f is a geometrical factor to account for path length through water and Z is the water depth. Other models developed by Benny and Dawson (1983), Stove (1985), Philpot (1989), and Lee et al. (1999) were also studied.
Regression Algorithms
As far as the regression is concerned the expression should be in the most simplified form. The single-band depth algorithms derived from the above model can be written in a common simplified form for channel i
where Xi = ln(Li - Lsi), aoi = (1/Kif)ln(LoiRbi) and a1i =-1/Kif
The above equation can be regressed linearly with in-situ water depths. The limitation with a single band method is that changes in the bottom reflectance within the area of interest will cause errors in the depth calculation. Predes and Spero (1983) derived the n-band/n-bottom type case as
We modified the above algorithm by writing equation (2) for 3 bands as simultaneous equations and finding the single expression for z for the 3-band case. The form of the series obtained:
For the present bathymetric application we used the series up to the term displayed above and the coefficients were determined by regression.
Data for the Area Under Investigation
The study area is the shallow water region in the Straits of Penang, Malaysia (between latitudes 5.30° to 5.45° N and longitudes 100.30° to 100.40° E). Images scenes of SPOT and TM captured on 1 January 1997 and 28 February 1997 respectively, were selected for analysis. The bathymetric chart of Penang (chart 1366, 1:60000 scale, published at Taunton, England, revised in 1999) was used for reference. New depth sounding data measured using echo sounder were available. Tidal data corresponding to the scenes were acquired. Data on water quality parameters and other oceanic parameters were not available for reference.
Data Processing
Depth Points and Pixel Values for Calibration
The water depth measurements were corrected for tidal height variations and the readings were reduced to the level of the Lowest Astronomical Tide (Chart Datum). The tidal data relevant to the analysis of tidal correction were taken from the published tide tables (Royal Malaysian Navy, 1999). The number of points chosen for depth calibration and validation were 175 and 43 respectively.
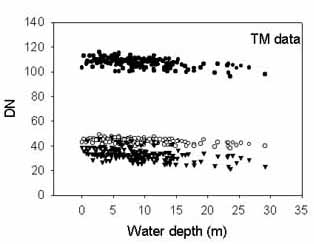
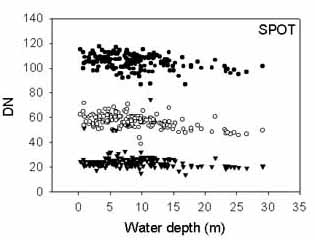
The image pixel positions were related to the geographical coordinates through rectification to the bathymetric chart using selected ground control points and second-degree polynomial transformation equations. The locations of these sounding points were then transformed into image scan-line and column-numbers by using the corresponding calibrated transformation equations obtained from the rectification analysis. The pixel intensities (digital values) at these points were then obtained for bands 1, 2 and 3. For each pixel location, a 3 by 3 sample window was used for the extraction of the pixel value. The actual water height at any point during image acquisition was determined by adding the height of the tide above chart datum to the corrected depth obtained earlier. The data quality for bathymetric application using each data set was validated by observing the distribution of the data on the plot of pixel intensity versus depth (Figure 1).
Determination of Deep-water Radiance
One of the prerequisites of the algorithms listed above is the value of the deep-water radiance for each band. The procedure involved finding the pixel value of a deep-water area within the scene. The deep-water radiance is normally (but not always) characterized by the lowest digital number in each band.
Due to the high degree of uncertainty in obtaining these values from the image inspection approach, we determined this parameter by optimizing equation (2) through regression analysis. The iteration process determined the optimum value of Lsi. This method was adopted in this study because the calibration accuracy was found to be better than the regression results using the deep-water radiance obtained by image inspection.
The results of the analysis gave the Lsi values in terms of DNs for the first 3 bands at about 80, 25 and 8 for the TM data and the SPOT scene gave values of 60, 20, and 10 respectively.
Calibration Regression
A least squares minimization was performed to calculate the best values of the coefficients in the algorithm. The results using all the data points showed high RMS error due to the presence of many outliers that degraded the calibration accuracy. To minimize the root-mean-square (RMS) error, the points having high residuals were discarded. After a sufficient number of iterations to discard these outliers only 168 points were retained. The RMS deviation error and correlation coefficient, R, for each data set were noted.
Inspection of the regression results indicates that the accuracy increases from the single-band to the three-band algorithms. The proposed algorithm produced some improvement over the conventional three-band method. This algorithm was used for further analyses. The results using the proposed algorithm are displayed in Table 1.
Validation of the Calibrated Algorithm
The validation data sets, which were not used in the calibration regression analysis, were then used for depth evaluation. Each calibrated algorithm was applied to the respective remotely sensed data set. Scatter plots of depths from chart versus calculated depths were made and the correlation coefficients determined (Table 2).
Generation of Water Depth Maps
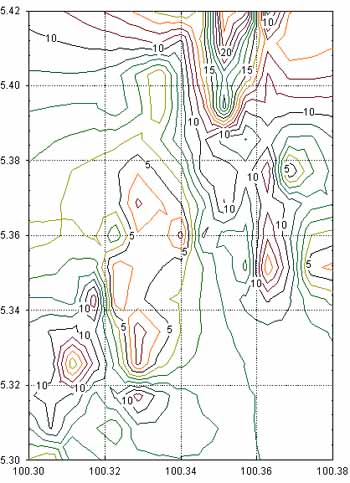
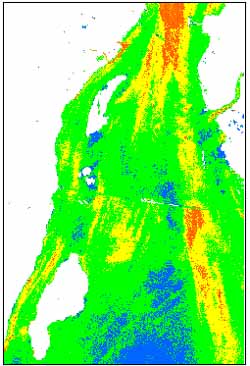
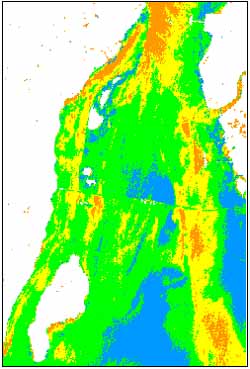
The water depth readings from echo sounding were used to plot the suggested updated bathymetric map of the area (Figure 2). Assessment for the contribution of remote sensing data for bathymetric charting was made using the present data sets. Each calibrated algorithm was applied to the corresponding multispectral image on a pixel-by-pixel basis. The land and cloud pixels were masked out using the infrared bands. The density?sliced depth images were geometrically corrected to the same coordinate system of the generated bathymetric map. The generated maps were colour-coded for display of the different depth contours (Figure 2).
Results and Discussion
The newly bathymetric map shows close similarity in depth patterns with the generated depth maps using remote sensing data. Observation of the plots of intensity versus depths and the results of calibration and validation for all the data sets reveal that TM and SPOT have comparable performances. TM and SPOT displayed nearly similar depth patterns. The principal error arose from the effect of water turbidity. Non-uniformity in the water turbidity and bottom reflectance caused additional complexities with this technique.
Conclusion
New depth information was obtained from the techniques employed in the present study. The results seggest that the existing bathymetric maps need to be updated. Remote sensing data can provide a valuable contribution in bathymetry. However, the environmental conditions may have a major influence in the accuracy of the technique.
Acknowledgment
This study is partially supported by the National Space Development Agency of Japan through the joint NASDA-ESCAP project entitled 'National Capacity building for sustainable environment and natural resources management through research and studies on the use of ADEOS data' and the Malaysian Government IRPA Grant no: 08-02-056011. Thanks are extended to Universiti Sains Malaysia.
References
- Benny, A. H. and Dawson, G. J., 1983. Satellite imagery as an aid to bathymetric charting in the Red Sea. Cathographic Journal, 20: 5-16.
- Lee, Z. P., Carder, K. L., Mobley, C. D., Steward, R. G., and Patch, J. S., 1999. Hyperspectral remote sensing for shallow waters: 2 . Deriving bottom depths and water properties by optimization. Applied Optics, 38: 3831-3843.
- Lyzenga, D. R., 1978. Passive remote sensing techniques for mapping water depth and bottom features. Applied Optics, 17: 379?383
- Peredes, J. M. and Spero, R. E., 1983. Water depth mapping from passive remote sensing under a generalized ratio assumption. Applied Optics, 22: 1134-1135.
- Philpot, W. D., 1989. Bathymetric mapping with passive multispectral imagery. Applied Optics, 28: 1569-1579
- Royal Malaysian Navy, 1999. Tide Tables, Vol. I, 2000. Hydrographic Branch, Royal Malaysian Navy.
- Stove, G. C., 1985. Use of high-resolution satellite imaging in optical and infrared wavebands as an aid to hydrographic charting and coastal engineering. Proceedings of the Technical Programme, Electronics in Oil and Gas, London, pp. 509-530.
| SPOT | TM | ||
| Calibration | R | 0.59 | 0.57 |
| RMS (m) | 4.7 | 4.6 |
Table 2 Validation results for the data sets
| SPOT | TM | ||
| Validation | R | 0.31 | 0.54 |
| RMS (m) | 6.5 | 5.12 |
 |
 |
(a) |
(b) |
| Figure 1 Intensity versus
depth for (a) TM and (b) SPOT data (solid circles for band 1, circle
for band 2 and solid triangle for band 3) | |
 | |
(a) | |
 |
 |
(b) |
(c) |
| Figure 2 Bathymetic maps (a) using measured depth sounding points, (b) TM, and (c) SPOT data (colour code: blue 0-5m, green 5-10m, yellow 10-15m and orange>15m) | |