| GISdevelopment.net ---> AARS ---> ACRS 2000 ---> Poster Session 2 |
Study on Land Use Management
with Geographic Information Systems
Wei-Hsin Ho
Professor, Department of Land Economics,
National Chengchi University,
64, Chih-nan Rd., Sec. 2, Wenshan, Taipei , Taiwan
E-mail: whh@nccu.edu.tw
and
Ge-Wen Lee
Ph. D. Candidate Student, Department of Civil Engineering,
National Chiao Tung University,
Hsin-Chu, Taiwan
E-mail: bearlee@cc04.ccit.edu.tw
Keywords: Land Use, Geographical Information
Systems, Potential Areas of Slope Disease Professor, Department of Land Economics,
National Chengchi University,
64, Chih-nan Rd., Sec. 2, Wenshan, Taipei , Taiwan
E-mail: whh@nccu.edu.tw
and
Ge-Wen Lee
Ph. D. Candidate Student, Department of Civil Engineering,
National Chiao Tung University,
Hsin-Chu, Taiwan
E-mail: bearlee@cc04.ccit.edu.tw
Abstract
Geographic Information Systems (GIS) have powerful tools to the analysis of spatial data and the management of land information. The article concentrates on how GISs can improve the land use management. The first step was to design a database based upon the requirements of land use management. Owing to the widely scope of land use management, the requirement analysis specifies on the delineation of development potential areas and development constraint areas for land use. Secondly, a fundamental toolbox was established under PC ARC/INFO and Visual Basic Ver. 6.0. Finally, a application system was constructed on the foundation of the fundamental toolbox. The Nantou County, a mountainous county in central Taiwan, which has abundant natural resources, was selected as the study area. In addition, a set of rules derived in this investigation was applied to predict the potential areas of slope disease. Results of the case study confirm the design of database and the application system. The experiences of the case study indicate the open system and the modulation design are useful to develop a flexible system. Metadata is important to describe the content and usage of database. Moreover, metadata can assist the interface design of the software.
1. Introduction
Geographic Information system (GISs) is a novel technology widely used to survey the land use problem. The GIS adopts the numerical methods and spatial analysis tools to delineate the land use. The methods can yield the same results after repeatedly applying the same procedures. Moreover, they reduce the manpower and time consumption for the delineation of land use. In contrast with the manual methods, the GIS is the most economic and objective methods.
This article describes a pilot study to land use management with GIS. The investigation designed a delineation system of land use with a GIS software (PC ARC/INFO) and a high-level language (Visual Basic). Also constructed herein is a database to implement the delineation of land use. For the effective usage of the database, the metadata which described the attribute definition, code meaning, data quality and production information of maps was generated while the maps were input to the database. Finally, a case study about potential was conducted to evaluate these designs.
2. System Design
2.1 System Framework
The analysis system of land use consists of a module based software, databases and metadata. The fundamental analysis software was designed by PC ARC/INFO SML language. Some tools embedded by the graphic user interface were written by Visual Basic. These tools offer the functions of project management and data management. Visual Basic produces not only a friendly environment for the users, but also effective tools to integrate all the elements in the system. Figure 1 shows the relation between the elements.
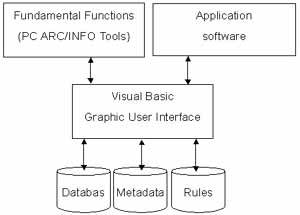
Figure 1 The Framework for the Delineation System of Land Use
2.2 System Operation
The system has two operation modes: project management mode and case study. The project management mode can generate a project directory and store the results in the directory. The case study mode provides a relatively easy means of testing the system tools case by case. Under the graphic user interface, the users can select the interest coverage and input the proper parameters.
3. Database
3.1 Database Organization
The database has three sub-databases such as geographic and land use database, project database and test database. Herein, a tree structure was designed to manage these data. The graphic and geographic database including the land use data is the primary database for the system. This database consists of sixteen coverage items such as land use, geology, soil, water system, road system, boundary line, forest map, and national park map, coastal conservation map, slope map, relic place map, natural ecological protection map, water quality and water quantity conservation map. The project database stores the data generated from each individual project. The test database is a temp directory for the data generated from the system test. The following paragraphs describe data processing and the contents of the geographic and land use database.
3.2 Data Source and Gathering
Three types of data were used in the database: the coverage obtained from Construction and Planning Administration, digital topographic maps published by Interior of Ministry, and 40m by 40m Digital Elevation Model (DEM) supplied by Center for Space and Remote Sensing Research, National Central University.
The processes, transferring the source data to database, include generalization, aggregation, and reclassification. The generalization of coverage is to eliminate the unwanted attributes and graphic entities in the coverage. The aggregation of features in the coverage was to combine the data with the similar characteristics to the same category. The reclassification of features in the coverage set the new category for the selected data according to the specified conditions. While the data are input to the database after the above processes, the description data that are relevant to the data should be established sequentially.
3.3 Metadata
The metadata offered by the database greatly benefits the understanding of the data users. In addition to the database description, the metadata can support the functions of analysis tools, for example, attribute selection (Ho, 1997). The metadata not only enhance the understanding of the users, but also assist the item selected in the analysis system. Figure 2 presents an example of usr interface created from metadata. The elements of metadata include database description file, project description file, attribute list file, code table list, code table, map boundary file, project list file, coverage list file, coverage description file, the results list file, description file of the results and map symbol description file. .The detail description of metadata can be found in Ho (1998).
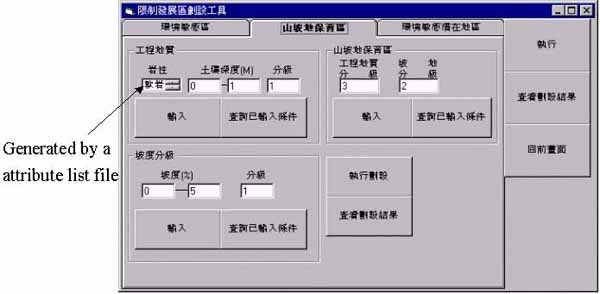
Figure 2 An example of user interface creating from metadata
4. Case Study
4.1 Study Area
The study area for potential areas of slope disease is the Nantou County, a mountainous district in the central Taiwan. Owing to the weakened geologic formation at some areas in the county, the natural disease occurs annually. Notably, the pollution and environmental damage are slight because the primary land use is agriculture and forestry.
4.2 Rules of Delineation
Figure 3 displays the procedures and the rules to delineate the potential areas of slope disease. The rules derived from the construction laws, The White Book of Construction Planing Strategy, and reports of Construction and Planning Administration (1993) and Chen (1993). The construction laws referred Yiin(1997).
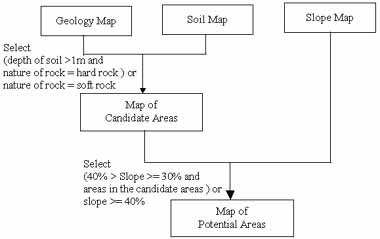
Figure 3 The procedures and rules for the case study
4.3 Results
Figure 4 represents the potential areas of slope disease in this case study. Some disease areas of 921 earthquake in 1999 just located nearby the predict areas in Figure 4. Although the rules conducted in this case study were not novel, the system had the capability to find out the similar areas on real disease areas. More rigorous investigation should achieve more exactly prediction.
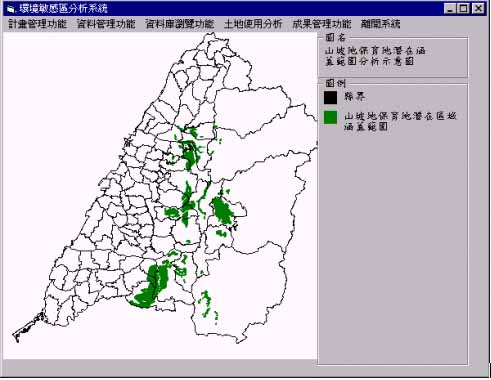
Figure 4 The potential areas of slope disease
5. Conclusion
The application system integrates four major components for identifying the suitable land use: (1) a geo-referenced database, (2) a fundamental toolbox for basic analysis of land use, (3) three subsystems for specific purpose and (4) a system for geographically displaying. Implementing such system provides the following advantages.
- The graphical interface allows the user to easily evaluate the type of land use.
- The system makes it easy to understand and prepare the required data for land use.
- The system's generic structure can be applied in different study areas and different evaluations.
- The system's modular structure is easily enhanced or modified with
additional models. Except for the above benefits of the delineate
system, the case study presented herein provides an interesting result
that the potential areas of slope disease is similar to the recently
disease on the study area, for example 921 earthquake. This result
indicates the opportunity that more advanced study about these rules can
achieve more exactly areas of such disease. Moreover, the case study
proves that GIS is a useful technology to land use management.
Acknowledgement
The Authors would like to thank the National Science Council of the Republic of China for financially supporting this research under Contract No. NSC87-2621-P004-004.
References
- Chen, R. C. et. al 1993. Study on the Project of Conservation Area in The Science-based Industrial Park, Report of Hsinchu Science-based Industrial Park, Hsinchu, Taiwan, R.O.C. (by Chinese)
- Construction and Planning Administration (CPA) 1997. An Overview of the Construction and Planning Administration, Construction and Planning Administration, Ministry of Interior, Republic of China, http://www.cpami.gov.tw/~unalis/introduce/e-index.html.
- Construction and Planning Administration (CPA) 1993. Environmentally Sensitive Areas delineation and Land use Suitable Analysis in Taiwan (The North and The South Areas), technical report of Construction and Planning Administration, Ministry of Interior, R.O.C. (by Chinese)
- Construction and Planning Administration (CPA) 1996. The White Book of Construction Planing Strategy, edited by Construction and Planning Administration, Ministry of Interior, Republic of China. (by Chinese)
- Council of Agriculture (COA) 1997. Starting A New Era for Agriculture: Environment, edited by Council of Agriculture, Republic of China, 1997,http://www.coa.gov.tw/en/e5.htm.
- Environmental System Research Institute (ESRI) 1991. Surface Modeling with TIN, ARC/INFO User's Guide 6.0" edited by Environmental System Research Institute, Inc.
- Ho, Wei-Hsin 1997. Study on the Support System for the Land Use and Land Conservation (II), NSC Project Research Report, NSC86-2621-P004-004, Taipei, R.O.C. (by Chinese)
- Ho, Wei-Hsin 1998. Study on the Support System for the Land Use and Land Conservation (III), NSC Project Research Report, NSC87-2621-P004-004, Taipei, R.O.C. (by Chinese)
- The Coalition of Wetland Protection 1997. What is the wetland, edited by The Coalition of Wetland Protection, Republic of China,http://http://www.wetland.tw.com/. (by Chinese)
- Yiin, J. H. 1997. The Compilation and Analysis of the Construction Laws, published by Sun-Min, Inc, Taipei, R.O.C. (by Chinese)