| GISdevelopment.net ---> AARS ---> ACRS 2000 ---> Poster Session 2 |
Multisource data fusion-
fusing optical and sar data for irrigated rice areas identification
Jirathana
WORAWATTANAMATEEKUL
Canisius X.J.F.
Lal SAMARAKOON
Asian Center for Research on Remote Sensing
Asian Institute of Technology
P.O.Box 4 Klong Luang, Pathumthani 12120
Tel: (66)-2-524-6148 Fax: (66)-2-524-6147
E-mail: jirathan@ait.ac.th
THAILAND
Keywords: Data Fusion, Principal Component
Analysis, Thematic CombinationCanisius X.J.F.
Lal SAMARAKOON
Asian Center for Research on Remote Sensing
Asian Institute of Technology
P.O.Box 4 Klong Luang, Pathumthani 12120
Tel: (66)-2-524-6148 Fax: (66)-2-524-6147
E-mail: jirathan@ait.ac.th
THAILAND
Abstract:
Food security has become a global key issue, and this is a major concern particularly to Asian region due to rapid expansion of Asian population. In many countries of the region, accurate evaluation of food production and estimation is not possible due to lack of information. Further, insufficient or obsolete information hampers timely solutions when there is a decrease in production, and introducing appropriate solutions for increase productivity. One of the basic information that is not available in most of the countries in Asian region is the cultivated area that could keep the planers well informed of the future harvest, and prepared for food crisis in advance. This paper examined the potential of satellite remote sensing in estimating irrigated paddy cultivated areas in a test site in Indonesia. Due to frequent cloud cover in this area solely rely on optical sensor data is a limiting factor of using satellite data for mapping. Attempt was made to integrate SAR data acquired during growing period with optical data to overcome this limitation. Data from JERS-1, optical and SAR data was used for the study. Applying various fusion methods, it was found that combination of vegetation index, average intensities of SAR, and principal component of optical data gives the optimal solution for the test area. Results proved data fusion from different sources acquired in various stages irrespective to their source could satisfactorily be used in estimating irrigated paddy area under cultivation.
1. Introduction
Data fusion means a very wide domain and it is rather difficult to provide a precise definition. Several definitions of data fusion have been proposed. Pohl and Van Genderen (Wald, 1999) defined “ image fusion is the combination of two or more different images to form a new image by using a certain algorithm” which is restricted to image. Hall and Llinas (Wald, 1999) defined “data fusion techniques combine data from multiple sensors, and related information from associated databases, to achieve improved accuracy and more specific inferences that could be achieved by the use of single sensor alone”. This definition focused on information quality and fusion methods. According to these definitions, it could imply that purposes of data fusion should be the information obtained that hopefully should at least improve image visualization and interpretation.
There are several fusion approaches, generally, fusion can be divided into three main categories based on the stage at which the fusion is performed namely: pixel based, feature based and decision based. In pixel based fusion, the data are merged on a pixel-by-pixel basis. Feature based approach always merge the different data sources at the intermediate level. Each image from different sources is segmented and the segmented images are fused together. Decision based fusion, the outputs of each of the single source interpretation are combined to create a new interpretation.
Although there are many data sources for the purpose of fusion, this study was mainly dedicated to only remote sensing data fusion and their visualization with the following possibilities; multitemporal and multisensor data fusion. Several remote sensing data have been acquired and some possible fusion techniques were applied to these data to generate image fusion results. Results of fused data were demonstrated and interpreted in terms of its usefulness in irrigated rice field identification.
2.Test Area and Data Used
Semarang is the selected test area and located in Central part of Java Island, Indonesia. This area is predominated by paddy rice. Both optical and SAR data were used in this study. Figure 1 shows false color composite of JERS-OPS data of test area, table 1 present satellite data descriptions used in the study.

Figure 1: False Color Com posite Image of the Test Area
Table 1: Descriptions of Remote Sensing Data Used
| Satellite | Sensor | Date |
| JERS-OPS | Visible-NIR | 24/8/96 |
| JERS | SAR | 29/09/96 |
| JERS | SAR | 12/11/96 |
| JERS | SAR | 24/03/97 |
Methodology
All remotely sensed data both optical and SAR data required systematic corrections. The data distributor normally provides this step. Speckle reduction by applying speckle specific filter is the next process applied to SAR data to reduce the data noise while retaining the information. Subsequently, 16 bit SAR data were converted to 8 bit data to be able to compare with 8 bit optical data. In the optical side, the data were necessary to go through atmospheric correction step. Then, both optical and radar data were coregistered in order to be fused together. Finally, the visualization step presents results of fusing data. Figure 2 shows general steps in fusion process.
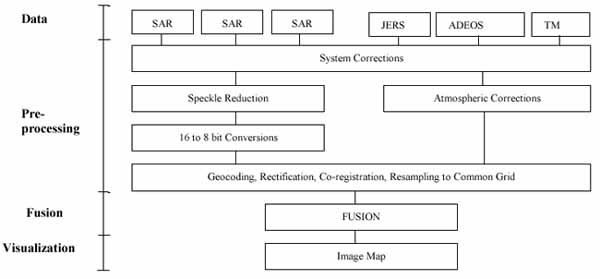
Figure 2: Data Fusion Process
Figure 2 shows general steps in data fusion process. However, it is necessary keeping in mind that the previous steps in the flow are crucial for the succeeding steps and therefore to the overall accuracy of the image map. Selection of data for fusion is very important as fusing inappropriate data could deteriorate information content.
All optical and SAR data were pre-processed and coregistered into the same coordinate system. At the fusion step, we applied several fusion techniques and compared the fused results. Those techniques are overlay, principal component analysis (PCA) and thematic combinations.
3.1 Overlay
Overlay of multi temporal data and display in different color channel of RGB. This technique is suitable to apply to single frequency or single polarization data like SAR. Not only this technique renders some colors to the interpreter but it also present changes during the acquisition period of the multidate data.
3.2 Principal Component Analysis
The purpose of applying principal component analysis (PCA) is to reduce the dimensionality of input data into a smaller number of output channels. It is more suitable to multi spectral data where each spectral band is always highly correlated. In PCA, the most information of input will be transformed into the first component and the information content decreases with increasing of the number of PCA component. As indicated in Figure 3, there is a scatter diagram plot of the original gray level value in band A and band B. Superimposed on these original axis is the new axis (axis I and axis II) which defined the direction of the first and the second principal components. PCA is the relationship that transforms the original value from band A/band B coordinate system to the new axis (axis I/axis II) system (Lillesand et al., 3rd Edition) and it is the linear relationship (see figure 3).
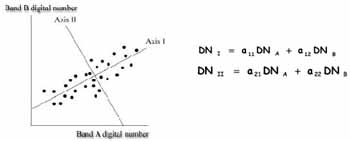
Figure 3: Graphical representation of Principal Component Analysis (PCA)
3.3 Thematic Combinations
The purpose of thematic combination is to combine the information rather than the base data. By this mean, the source data are not necessary converted to one common format (e.g. resampling to one resolution) before deriving information and therefore less information are lost. In this study, information was derived from optical and SAR data sources separately and each technique was evaluated using the correlation coefficient. NDVI image, PCA of JERS-OPS and average of multitemporal SAR data were investigated for the purpose of irrigated rice area identification.
4. Results
Results from applying the above fusion techniques are demonstrated and interpreted to show the derived information.
Overlay three SAR images not only render different colors related to different information but also provide changes information. In the RGB image (figure 4), gray, white and dark color represented no changes area (during Sep’96 to Mar’97) meaning that the bright white color in the image demonstrated a stable land use which has been no changes during such period. In this image, those are settlements (indicated by red circle). Another primary colors, Red, Green and Blue represented changes (changes of backscattered energy) area. Red color indicated the object that gave higher backscatter in September than in November and March. Green and Blue color are followed the same rule. Green indicated the area where the object provided higher backscatter in November while lower in September and March. Blue represented the area containing the object that gave high backscatter in March and low backscatter in September and November. Usage of cropping calendar in this area will help in more detailed interpretation.
Principal components derived from JERS-OPS multispectral data (3 bands) were demonstrated in figure 5. The first component (PC1) contained highest variance (indicated by more variation of gray levels) and therefore contained most information compared to the succeeding components PC2 and PC3. Thus PC1 were then used as one theme for thematic combinations instead of using 3 bands of optical data.
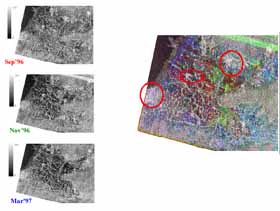
Figure 4: Show original multitemporal Images (Sep’96, Nov’96 and Mar’97) and their overlay result in RGB channel
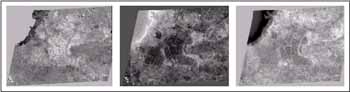
Figure 5: Principal Components of JERS-OPS data from left to right PC1, PC2 and PC3
Figure 6 shows the information derived from JERS-OPS and JERS-SAR namely, NDVI image, the first principal component and average of three date SAR images respectively. NDVI value will determine how much green vegetation presented in a particular area. In the NDVI image presented here the lowest area NDVI is indicated by blue color and the highest indicated by red color. Same as PC1 image the lowest value is ranged from blue to the highest in red color. Average SAR images is presented in gray scale image where dark meant low backscatter and bright meant high backscatter.
All the information (figure 6) derived from both OPS and SAR were then be the input bands for the classification process. Unsupervised method was applied 2 times and the result is shown in figure 7. This classified image result was checked and it had the correspondence with the field information.
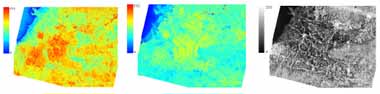
Figure 6: From left to right: NDVI image, PC1 image and average of 3 SAR images
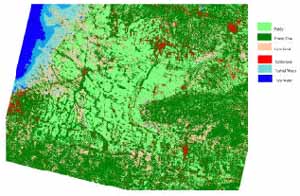
Figure 7: Unsupervised classification result
5. Conclusion
Combining of data from different sources using thematic combination seems to be the most appropriate technique because less information were lost. However, the information obtained from this study still requires more field information to verify the applicability of fusion technique presented here. Further, fusion among multi sensor and multi systems could require more parameters for instance satellite geometry, spectral band width etc. complexing the interpretation.
References
- Lillesand M.T., Kiefer W.R., Remote Sensing and Image Interpretation, 3rd Edition, P572, John Wiley & Sons, Inc, New York.
- Soldberg, A. H., 1994, Multisource classification of Remotely Sensed Data: Fusion of Landsat TM and SAR Images, IEEE Transactions on Geoscience and Remote Sensing Vol.32 No.4 July 1994 pp768-776.
- Wald L., 1999, Some Terms of Reference in Data Fusion, IEEE Transactions on Geoscience and Remote Sensing Vol.37 No.3 May 1999 pp1190.