| GISdevelopment.net ---> AARS ---> ACRS 2000 ---> Poster Session 2 |
Land Cover Change and
Long-Term Fluctuation of Evapotranspiration in Okutama
Susumu Ogawa* and Nobuaki
Naito**
Faculty of Geo-Environment Science, Rissho University
1700 Magechi, Kumagaya, Saitama, 360-0194 Japan
Phone: +81-48-539-1652 Facsimile: +81-48-539-1632
E-mail: *ogawa@ris.ac.jp; **981w00037@ris.ac.jp
Keywords: water balance, remote sensing,
Landsat TM, forest, paddy fields Faculty of Geo-Environment Science, Rissho University
1700 Magechi, Kumagaya, Saitama, 360-0194 Japan
Phone: +81-48-539-1652 Facsimile: +81-48-539-1632
E-mail: *ogawa@ris.ac.jp; **981w00037@ris.ac.jp
Abstract
Land cover change and fluctuation of evapotranspiration were examined in Okutama using Landsat TM data. Most land cover was composed of forest in Okutama. Forests had changed the constitution of evergreen and deciduous trees, while agricultural fields had decreased for the examined period. The long-term water budget from 1959 to 1997 in this basin showed that annual mean evapotranspiration increased and runoff ratio decreased. The short-term water budget showed that the monthly mean evapotranspiration fluctuation in May, July and October changed for that period. Such change may be caused by the decrease of the paddy fields and the change of its forest constitution.
1. Introduction
In Okutama good conditioned forest for drinking water has been kept for stable river flow and Ogouchi Reservoir. However, relationship between land cover change and water budget is still unknown. Therefore, in this paper runoff fluctuation with land cover change in Okutama was examined by two-date satellite data for land cover change and water budget for 39 years. Moreover, the forest state of drinking water was confirmed to make the future plan for forest management (Aoyama, Nishikawa & Murai, 1990; Kazama, Tada & Sawamoto, 1996; Sado & Wei, 1996; Sado, 1996).
2. Materials and Method
2.1 Data Used and Observation Stations
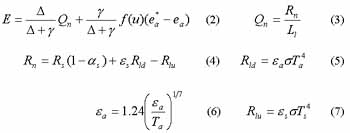
Objective area is located over upper stream catchment above the Okutama Lake: Ogouchi Reservoir. Two date satellite data were used for land cover classification and each area calculation. Watershed separation was carried out with digital elevation models '25,000' and '50m-mesh' by the Geological Survey Institute, Japan. Water budget was obtained from hydrological data from 1959 to 1997 in Okutama. Dam-inlet observation station is located at the Ogouchi Dam, while rainfall observation stations are located at Tabayama, Kosuge, Ochiai, and Okutama (Fig. 1; Waterworks Bureau, Tokyo Metropolitan Government, 1959-1997). For calculation of evapotranspiration meteorological data at Tokyo and Chichibu Local Meteorological Observatories were used (Meteorological Agency, 1968-1997). The objective watershed was determined semi-automatically with GIS software from digital elevation models '50m-mesh' by the Geological Survey Institute.
2.2 Water Balance
From annual rainfall and dam-inlet flow rate in long-term observation at the Ogouchi Reservoir, annual evapotranspiration was obtained by the next equation.
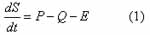
where S is the watershed storage, t time, P precipitation, Q flow rate, and E evapotranspiration. For long-term observation, the left hand of Equation (1) should be ignored. Therefore, annual evapotranspiration becomes the difference between annual precipitation and flow rate. In this area groundwater is not used and watershed area is small. Thus, short-term water budget method (Suzuki, 1985) was also applied for monthly evapotranspiration by the calculation of difference between precipitation and flow rate each rain.
2.3 Penman's Method
Daily evapotranspiration each land cover is calculated from meteorological data with the Penman's method.
where D=(de*/dT)T,gºcPP/el , Qn the available energy flux in mm/day, f(u) the wind function in mm/day · hPa, u the mean wind speed in m/s, ea* the saturation water vapor pressure in hPa, ea the vapor pressure in hPa, Rn the net radiation in W/m2, Ll the latent heat of vaporization (=2.454×10⁶J/kg), Rs the global short-wave radiation in W/m2, as the albedo of the surface, Rld the downward long-wave or atmospheric radiation in W/m2, Rlu the upward long-wave radiation in W/m2,es the emissivity of the surface(= 0.97),ea the atmospheric emissivity, s the Stefan-Boltzmann constant (=5.67×10⁻⁸Wm-2K-4), Ta the air temperature in K, Ts the surface temperature in K.
Here, daily evapotranspiration for forest only was calculated. The albedo was cited from the empirical values (Kotoda, 1986).
2.4 Land Cover Classification
Land cover was classified into seven categories, urban area, paddy fields, vegetable fields, evergreen forest, deciduous forest, grass, and water body from two-date Landsat TM with supervised classification. From these results area ratios each land cover were obtained. The ground truth was carried out in 1999 and 2000.
3. Results and Discussion
3.1 Land Cover Change
Land cover classification in 1984 and 1995 was carried out. Table 2 shows the area ratios each land cover. The forest area in 1984 was 92.8 % of the total watershed, while that in 1997 increased to 97.2 % by 4.4 %. The agricultural area decreased from 2.9 % to 1.5 % during the same period. These results coincide with 'Agricultural Field Area Statistics' in trend as shown in Figure 2.
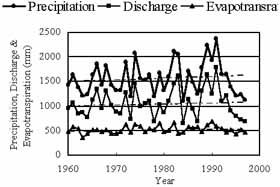
3.2 Long-term Water Budget
Figure 3 and Table 3 show the results of water budget from 1959 to 1997. Annual evapotranspiration and runoff ratio were calculated from annual precipitation and dam-inlet flow rate during the same period. The annual precipitation has constant trend, while the annual evapotranspiration increased 490 mm on average during 1959 and 1967 to 524 mm during 1988 and 1997. However, runoff ratio decreased for the same period as shown in Figure 4. These results seem to relate the increase of forest and the decrease of agricultural fields in area.
3.3 Estimated Evapotranspiration
Evapotranspiration was estimated by three ways, water budget, pan observation, and the Penman's method. Table 4 shows these results on average by three periods: 1968-1977, 1978-1987, and 1988-1997. Through all three methods, annual evapotranspiration has increase trend. However, the ratio of its increase equals between the pan observation and Penman's method, which are controlled by meteorological factors, while that of water budget is smaller than these two. That is, the results of water budget may be controlled by land cover change, which seems to be tree species change or the increase of forest and the decrease of agricultural fields.
3.4 Short-Term Water Budget
Figure 5 shows the results of short-term water budget. Monthly evapotranspiration fluctuated each period, 1959-1967, 1968-1977, 1978-1987, and 1988-1997. The results show that the monthly evapotranspiration decreased in trend in May and October, and increased in July. These months coincide with the periods of seeding, mid-term drying, and final drying in paddy fields (Makino, Ogawa & Saito, 1999). Therefore, the fluctuation of the monthly evapotranspiration may be the results of agricultural water use change with the policy of paddy field reduction.
4. Conclusion
From hydrological and satellite data, annual water budget and evapotranspiration in the upper Tama River were analyzed to conclude the next items.
- From satellite data in 1984 and 1997, forest area increased from 92.8 % to 97.2 %, while agricultural fields decreased from 2.9 to 1.5 %.
- As a result of long-term water budget from 1959 to 1997, annual precipitation was constant, annual evapotranspiration increased moderately, but runoff ratio decreased in trend. It seems to be caused by forest constitution change or the increase of forest area and the decrease of paddy fields.
- As a result of short-term water budget, monthly evapotranspiration changed with corresponding to seeding, mid-term drying, and final drying in paddy fields. Therefore, the fluctuation of the monthly evapotranspiration may be the results of agricultural water use change with the policy of paddy field reduction.
The authors thank Waterworks Bureau in Tokyo Metropolitan Government for their hydrological data. We also greatly appreciate to Dr. Genya Saito, Mr. Naoki Ishituka, and Dr. Takuhiko Murakami at National Institute of Agro-Environmental Sciences, and Ms. Ikuyo Makino at Tokyo Institute of Technology for their cooperation.
References
- Aoyama, T., H. Nishikawa, and H. Murai, Journal of Remote Sensing Society of Japan, 20, 2, 539-551, 1990.
- Kazama, S., T. Tada, and M. Sawamoto, Annual Journal of Hydraulic Engineering, 40, 323-328, 1996.
- Sado, K. and R.Wei, Annual Journal of Hydraulic Engineering, 40, 323-328, 1996.
- Sado, K., Journal of Japan Society of Hydrology & Water Resources, 9, 2, 188-197, 1996.
- Waterworks Bureau, Tokyo Metropolitan Government, Annual Report of Ogouchi Reservoir Management, 1959-1997.
- Meteorological Agency, Meteorological Monthly, 1968-1997.
- Suzuki, M., Journal of Japan Society of Forest, 67, 4, 115-125, 1985.
- Kotoda, K., Estimation of River Basin Evapotranspiration, Environmental Research Center, The University of Tsukuba, 1986.
- Statistics and Information Department, Economic Affairs Bureau, Ministry of Agriculture and Forestry, Agricultural Field Area Statistics, 1973-1999.
- Makino, I., S. Ogawa, and G. Saito, Annual Journal of Hydraulic Engineering, 44, 283-288, 1999.
| Satellite | Date |
| LandsatTM | 1984/10/26; 1997/10/30 |
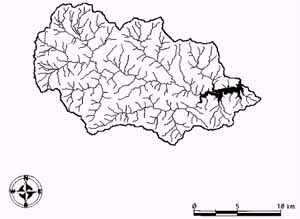
Figure 1 Okutama and its observation stations
Table 2 Land cover area rate in Okutama using LandsatTM (Unit:%)
| Year | Forest | Urban Area | Grass | Paddy Field | Vegetable Field | Water |
| 1984 | 92.8 | 0.4 | 2.6 | 2.1 | 0.8 | 1.3 |
| 1997 | 97.2 | 1.0 | 0 | 1.0 | 0.5 | 1.3 |
Figure 2 Agricultural area ratio in Okutama
Table 3 Annual mean hydrological observation results
| Period | Precipitation | Discharge | Evapotranspiration | Runoff ratio |
| 1958-1967 | 1550mm | 1060mm | 490mm | 0.68 |
| 1968-1977 | 1582 | 1067 | 515 | 0.67 |
| 1978-1987 | 1551 | 1013 | 538 | 0.64 |
| 1988-1997 | 1658 | 1135 | 524 | 0.67 |
Table 4 Annual mean evapotranspiration with water balance, pan evaporation, and Penman's method
| Period | Water Balance | Pan Evaporation | Penman's method |
| 1968-1977 | 515mm | 760mm | 655mm |
| 1978-1987 | 538 | 768 | 662 |
| 1988-1997 | 524 | 792 | 683 |
 |
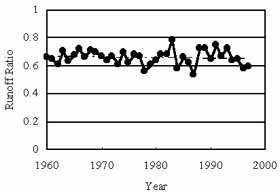 |
| Figure 3 Water balance in Okutama | Figure 4 Runoff ratio in Okutama |
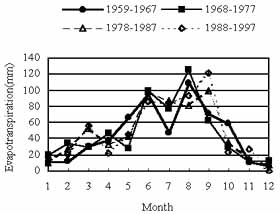
Figure 5 Monthly evapotranspiration in Okutama