| GISdevelopment.net ---> AARS ---> ACRS 2000 ---> Poster Session 2 |
Mapping and measuring the
troposphere pollutants originated from the 1997 forest fire in south east
asia.
Mazlan Hashim, Kasturi Devi
Kanniah, Abdul Wahid Rasib and Lim Chee Ming
Department of Remote Sensing
Faculty of Geoinformation Science and Engineering
Universiti Teknologi Malaysia
81310 Skudai, Johor, Malaysia.
Keywords: remote sensing, AVHRR, forest fire,
aerosols, gases, atmospheric pollutants. Department of Remote Sensing
Faculty of Geoinformation Science and Engineering
Universiti Teknologi Malaysia
81310 Skudai, Johor, Malaysia.
Abstract:
The massive forest fire in Indonesia in 1997 affected the whole Asian region by transporting large quantity of smoke plume with Malaysia bearing the brunt due to being nearer, wind direction and weather conditions. In this study, AVHRR (Advanced Very High Resolution Radiometer) satellite data were used to detect and subsequently map the five primary sources of fire pollutants namely Carbon monoxide (CM), Sulphur dioxide (SO2), Nitrogen dioxide (NO2), Ozone (O3) and particulate matter less than 10 micron ((PM10) in Peninsular Malaysia. A multi regression analysis was used in this study to establish a statistical relationship between atmospheric pollutants (ppm) readings recorded at 5 stations around the Peninsular and reflectance values from AVHRR data. This model, based on 5 samples was then applied to all the pixels in the image covering the whole Peninsular Malaysia. The obtained values are in parts per million (ppm) for all the constituents except for PM10 in ug/cu.m.
1. Introduction
In Southeast Asia, currently it has become evident by estimates from satellite remote sensing data that biomass burning play an important role in air pollution and atmospheric chemistry. Palm oil plantations in Riau and other Sumatera provinces are the main source of the fires as many companies use fire as a cheap method to clear the land for the next planting season (UNEP, 1999). Combustion products of biomass burning include various hazardous gases such as carbon dioxide, carbon monoxide, nitrous oxide, oxides of sulphur, methane, non-methane hydrocarbons, nitric oxide and various types of atmospheric particulates.
Gases and aerosols are very efficient at scattering sunlight. Scattering of solar radiation by aerosols can limit human visibility in the troposphere; this is the phenomenon known as haze. Some aerosols, especially black carbon particles created by fires, efficiently absorb sunlight and results in heating of the atmospheric layer, whilst, scattering properties cause a redistribution of radiation including losses back to space. In the lower atmosphere, aerosols and gases can modify the size of cloud particles which changes how the clouds both reflect and absorb sunlight thus, modifies the radiative budget. The 1997 and also the subsequent fire scenarios (1998, 1999 and Mac 2000) have affected the whole Asian regions with Malaysia bearing the brunt due to being nearer to Sumatera, wind directions (Monsoon Seasons) and weather conditions. In Malaysia, the main pollutant that is contributing to the haze is PM10, besides CM, SO2, NO2 and O3 (Vadivale 1997). Pollutants from forest fire can be hazardous to the environment and human health.
The ability to detect the extent and amount of the forest smoke plume during early stages of the disaster would greatly assist in the emergency response planning by responsible teams. Many studies have been conducted using remote sensing technique to map or measure the forest fire constituents (Kaufmann et al (1990), Cahoon Jr. et al (1994) and etc. used AVHRR data to estimate the particulates and trace gases originated from forest fire in Brazil, China and South America respectively. Satellite remote sensing can determine the distribution and total content of the pollutants over large areas. Coarse spatial and high temporal resolutions of AVHRR sensor onboard NOAA (National Oceanic and Atmospheric Administration) satellites made it possible to detect and monitor the fast spread of fire emissions over countries, regions or even continents continuously.
In this study NOAA AVHRR data were used to map and measure the spatial distribution of PM10, CO3, NO2, O3, and SO2 on 17, 28 and 29 of September, 1997 (period of thick haze episode) over Peninsular Malaysia. The current study is an extension of previous work that looked at the determination of haze in API (Air Pollution Index) units (Asmala, 1997).
2. Data and Technique
Channels 1 and 2 of AVHRR (short wavelength; 0.58- 1.10 mm) were selected to be used in the extraction of fire emission constituents information. Atmospheric molecules and other tiny particles that are much smaller in diameter than the wavelength of the interacting radiation are efficiently diffuse the radiation. The effect of Rayleigh scatter is inversely proportional to the forth power of wavelength and therefore there is much stronger tendency for short wavelengths to be scattered by this scattering mechanism than long wavelengths (Lillesand and Kiefer 1994). Hence, the contribution of measured radiance at the top of the atmosphere from the path radiance is larger for shorter wavelengths. Smoke originated from wild forest fire is not observable in the mid IR (2.2 mm) due to the large ratio of wavelength to the size of the particles. Kaufman (1993) also used sun photometer/ radiometer in the 0.44-1.03mm range to make measurements of the path radiance and the aerosol optical thickness from the ground.
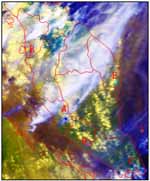
| Monitoring stations | Geographical location | ||
| Longitude | Latitude | ||
| A | Kuala Lumpur | 101°42.274'E | 0.3°08.286'N |
| B | Prai | 100°24.194'E | 05°23.890'N |
| C | Pasir Gudang | 103°53.637'E | 01°28.225'N |
| D | Bukit Rambai | 102°10.554'E | 02°15.924'N |
| E | Bukit Kuang | 103°25.826'E | 03°16.260'N |
Figure 1. Location of the 5 atmospheric constituents monitoring stations (shown by letters A, B, C, D and E).and their corresponding geographical locations. Fire emission constituents (ppm level) data were provided by Alam Sekitar Malaysia Berhad (ASMA). (Source: Ahmad and Hashim, 1999).
2.1 Method
All the procedures followed to map and obtain the amount of fire emission constituents were performed using the ERDAS Imagine (Digital image processing software) and SPSS softwares.
(i) Data calibration
Raw digital numbers (DN) of channels 1 and 2 of AVHRR data were first converted into percent albedo values. Such conversion is important because the resulting reflectance compensating for the in-orbit degradation of DN as a result of weather changes before and after the launch of AVHRR sensor into the space. The conversion of DN to radiance governs the following relationship.
where, Ai/ii is the percent albedo measured by AVHRR channels (channels 1 and 2 in this study), C is the input data value in counts (DN) and Si/ii and Ii/ii are respectively the slope and intercept values for bands 1 and 2. These calibration coefficients were obtained from Rao and Chen, 1998. These values are updated at NOAA/NESDIS in the 1B data stream at approximately one- month intervals.
| Satellite | Si | Ii | S2 | I2 |
| NOAA- 14 | 0.1318 | -5.4050 | 0.1657 | -6.7938 |
(Source: Rao and Chen, 1998)
(ii) Geometric correction
Image to image registration technique was carried out to register all the 3 calibrated images (dated 17, 28 and 29 September, 1997) to a master image. The master image is a digital map of the corresponding area captured originally by digitizing a topo map and then rasterized to 1 km grid size to match the NOAA AVHRR LAC data.
(iii) Atmospheric correction
The atmospheric correction for this study was performed using radiative transfer model with ground truth parameters like temperature, relative humidity, atmospheric pressure, visibility and height from sea level and zenith angle (satellite parameter) determined from historic data (Table 2). An assumption of a Lambertian surface was made because it considers a perfect diffusion and therefore facilitate the calculation. Reflectance values (after compensating for scattering and absorption of atmosphere) were obtained after performing the sequence of the following calculations;
- estimation of total optical thickness,
- estimation of atmospheric transmittance,
- estimation of total irradiance at the surface of the earth,
- estimation of the path radiance,
- estimation of the radiance sensed by the sensor and,
- estimation of the reflectance.
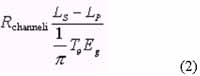
where,
R channel = reflectance after compensating for atmospheric attenuation, Ls = radiance sensed by the sensor, Lp= path radiance, Tq= atmospheric transmittance at q zenith, Eg= global irradiance reaching the surface of the earth.
| Parameters | Averaged value |
| Satellite zenith angle (°) | 36.52 |
| Temperature (° C) | 27.28 |
| Relative humidity (%) | 83.40 |
| Atmosphere pressure (mbar) | 1011.86 |
| Visibility (km) | |
| Altitude from sea level (m) | 14.16 |
(Source: Asmala Ahmad and Mazlan Hasim, 1999)
(iv) Cloud masking
It is necessary to identify and separate the cloud pixels from non- cloud pixels for the retrieval of smoke plume originated from forest fire. This is because of the enormous errors arising from cloud contamination when deriving atmospheric pollutants present in the smoke plume. In this study a simple technique (Q technique) which was proposed by Saunders and Kriebal (1988) was used.This technique is based on the ratio between the reflectance in the NIR and visible bands of AVHRR data.
Q values over cloud pixels are close to unity due to quite similar Mie scattering effects of the reflectance for both channels (Franca and Cracknell, 1995).
(v) Extraction of haze constituents
The measurement of space-borne remote sensing of gases and aerosol particles in this study is based on an assumed relationship between the ground measured aerosols and the spectral path radiance. Path radiance is detected by AVHRR sensor above a non-reflective surface and is the result of backscattering to space by particles and molecules in the atmosphere (Kaufman 1993). The amount of each of the 5 atmospheric constituents acquired at the 5 monitoring stations (dependent variables) and the calibrated reflectance from satellite data (independent variables) at the corresponding locations were used to establish empirical relationships between the aerosol and the scattered spectral path radiance. A multiple regression analysis (using both channels 1 and 2 of AVHRR) was carried out to predict some of the common but not validated assumptions about the spatial distribution and estimation of the amount of the particles over Peninsular Malaysia. The best model based on the best regression coefficients (r2) for each of the constituents was selected to be applied to every pixel of images dated 17, 28 and 29 of September 1997. The regression line/model expresses the best prediction of the dependent variable (haze constituents) at other locations all over Peninsular Malaysia.
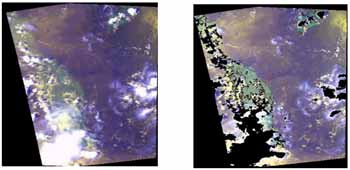
(a) (b)
Figure 3. Cloud masking using Q technique, (a) image of Peninsular Malaysia before cloud masking and (b) after cloud masking.
3. Results and Discussion
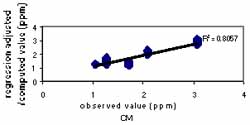
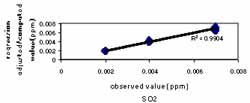
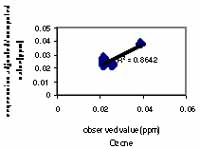
Table 3 shows the best model derived from multi regression analysis for each of the atmospheric pollutants. All the five pollutants reveal a good relationship where the r2 is exceeding 0.7. However, SO2 exhibits the strongest relationship between satellite reflectance and sulphur readings and this is followed by NO2, O3, CM and PM 10. These models were then applied on calibrated images to map the spread and the amount of these pollutants over Peninsular Malaysia.
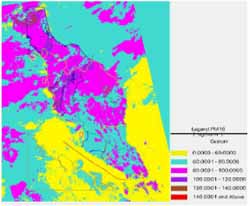
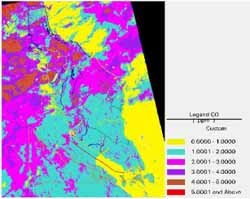
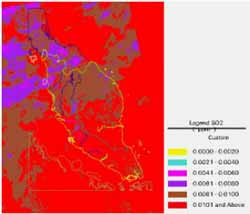
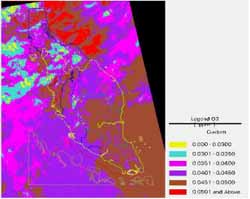
The ppm values for CM, SO2, NO2 and O3 and ug/cu.m value for PM10 observed over Peninsular Malaysia versus the regressed computed values using both bands 1 and 2 is shown in figure 4. Meanwhile, figure 5 shows the spread of the pollutants over Peninsular Malaysia. All the pollutants except for PM10 not been seen at unhealthy levels. When the measured level of each of the four pollutants were converted to a scale index (Air Pollution Index), they respectively reveal a value of less than 50 which is a good Malaysian air quality index. However, for PM10 156.84 ug/cu.m ( exceeds API value of 100) indicates this pollutant is an indicator of an unhealthy condition. PM 10 was identified as the main pollutant driving the atmospheric pollution during the fire in 1997 in Malaysia and is the concern of many people because it is respirable and can cause diseases like asthma attacks, chronic bronchitis, decreased lung function and etc.
4. Summary
Remote sensing data can be used for mapping air pollutants over large areas with minimum cost and time. The regression analysis using air pollutant readings obtained from observations stations and satellite reflectance shows good correlation for all the pollutants. Of all the five pollutants, PM10 was identified as the most hazardous pollutant present over Malaysian atmosphere during the 1997 forest fire scenario in South East Asia. The high level of this pollutant could also be contributed by construction activities and unpaved roads. The ongoing study using more sample points is anticipated to further improve the results of the study.
References
- Asmala Ahmad and Mazlan Hashim, 1997, Determination of Haze from remotely sensed data: some preliminary results, Proceedings of 18th Asian Conference on Remote Sensing 1997 in Kuala Lumpur, 20-24 October 1997, R-11-1- R-11-6, Asia Associate in Remote Sensing.
- Cahoon Jr., D.R., Stocks, B.J., Levine, J.S., Cofer III, W.R., dan Pierson, J.M., 1994, "Satellite Analysis of the Severe 1987 Forest Fires in northern China and Southeastern Siberia." Journal of Geophysical Research. 99(D9) ; 18,627 - 18, 638.
- Franca, G.B., and Cracknell, A.P., 1995, A simple cloud masking approach using NOAA AVHRR daytime data for tropical areas, IJRS, Vol.16, No.6, 1697-1705.
- Kaufman, Y.J., Tucker C.J.,dan Fung, I., 1990, "Remote Sensing of Biomass Burning in the Tropics." Journal of Geosphysical Research. 95 (D7) ; 9927-9939.
- Kaufman, Y.J, 1993, Aerosol Optical thickness and atmospheric path radiance, Journal of Geophysical Research, 98, 2677-2692.
- Lillesand, T M., and Kiefer R W., 1994, Remote Sensing and Image Interpretation, John Wiley & Sons, Inc.
- Rao, N.C.R and Chen, J., 1998, Calibration updates for the visible and near infrared channels of the Advanced Very High Resolution Radiometer on the NOAA- 14 spacecraft, http://140.90.207.25:8080/EBB/ml/niccal2.html (date of access: 08 December 1999).
- UNEP (1999). Levine, J.S., Bobbe, T., Ray, N., Singh, A. and R.G. Witt., Wildland Fires and the Environment: a Global Synthesis. UNEP/DEIAEW/TR.99-1.
- Vadivale, M., 1997, http://www.geocities.com/HotSprings/2188/hazemma.html (date of access: 09 March 2000).
| Atmospheric pollutants | Best regression coefficients (r2) | Model |
| Nitrogen dioxide (NO2) | 0.879 | y = -1.614 x 10⁻²(DN1) + 1.511 x 10⁻²(DN2) + 4.148 x 10⁻³) + 0.005 |
| Carbon monoxide (CO3) | 0.806 | y = -0.534(DN1) + 1.604(DN2) + 0.112) |
| Sulphur dioxide (SO2) | 0.991 | y = 0.005352(DN1) - 0.006247(DN2) + 0.007604 |
| Ozone (O3) | 0.864 | y = -0.005738(DN1) - 0.0005142(DN2) + 0.05224 |
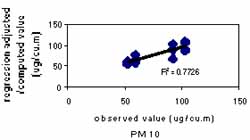
| PM 10 | 0.778 | y = 146.903(DN1) - 99.071(DN2) + 88.984 |
 |
 |
 |
 |
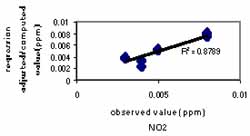 | |
Figure 4. The relationship between observed value and regression adjusted computed values (channels 1 and 2) for the five pollutants originated from forest fire emission.
 |
 |
 |
 |
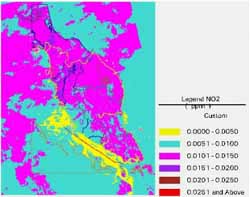 | |
Figure 5. The spread and amount of PM 10 CM, SO2,O3 and NO2 over Peninsular Malaysia during September, 1997.