| GISdevelopment.net ---> AARS ---> ACRS 2000 ---> Image Processing |
The statistical correlation
with invariant moments for Geometric correction improvement
Sompong WISETPHANICHKIJ, Kobchai DEJHAN, Somkid HANPIPATPONGSA, Fusak CHEEVASUVIT, Somsak MITATHA, Chanchai PIENVIJARNPONG*, Chatcharin SOONYEEKAN**
Faculty of Engineering and Reserch Center for Communication and Information Technology,
King Mongkut's Institute of Technology Ladkrabang, Ladkrabang,
Bangkok 10520, Thailand.
Tel : 66-2-3269967, 66-2-3269081, Fax : 66-2-3269086 -535254,
E-MAIL:kobchai@telelan.telecom.kmitl.ac.th
* National Research Council of Thailand,
MOS-I Receiving Ground Station, Ladkrabang, Bangkok 10520, Thailand.
** Aeronautical Radio of Thailand,
102 Ngamduplee, Tungmahamek, Bangkok 10120, Thailand.
Keywords: Statistical Correlation, Geometric
Correction
Abstract
The systematic and non-systematic (or random) distortions are major causes of geometric distortion on remote sensing images. The reliableness of all applications usage lay down on geometric correction methods. The precision method is images registration with ground control points, but the assigned GCPs position on the corrupted images with interference noise and burry cloud coverage is difficult and bore some task. Therefore, this paper presents a method to assign automatic GCPs by using image registration method based on sequential similarity detection algorithm (SSDAs) technique, called statistic correlation measurement. The subimage around GCPs are selected and applied with invariant moments method as prototype image to assign a precise positions of GCPs are without translation, rotation and scale change problems. The above sub-images will be applied with whitening filter, that are the results of statistic correlation measurement analysis under the assumption of Markov-process before image registration, geometric transformation and resampling to carry out a precision geometric correction.
1. Introduction
The systematic and non-systematic (or random) distortions are geometric distortion that appear on satellite image and necessary to correct before using. With the ground control points(GCPs), the precision of geometric correction will be done. The corrupted-image with cloud coverage and noise make mapping between GCPs and coincident areas on the image diffculty. To automatic register the sub-image around GCP from the improved image acting as prototype image to assign the positions of GCPs for the improving satellite image, the correlation will also be used in order to obtain the precision and accuracy. The geometric correction process geometrically converts the image coordinates from (x,y) to ) , (y x , where corrected coordinates without geometrical distortion are expressed by ) , (y x and input image corrdinates by (x,y). For Precision geometric correction could be preformed the image to image registration that one image is refered to be the reference image and assumed to be of good quality, i.e., no clound to present, contrast is good and geometrical distortion are negligible. The search (input) image, on the other hand, is relatively unknown quality. Some fog/clound cover may be present along with geometrical distortion. The important issue to achieve such process is the way to select the ground control point (GCP), which should be evident on both images or topographic map, time invariance and spread through out the image. For the sake of two images of the same scene cannot be meaningfully compared. Principal among these are cross-correlation, normalized cross-correlation as shown in eq.1 and minimum distance cirteria (Webber, 1973).
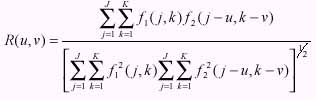
Equation -1
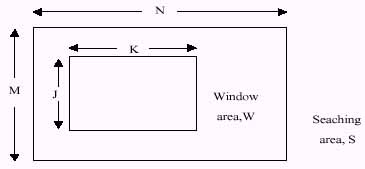
Figure 1. Relationship between search and window areas.
With translation, rotation and scale chane problems, the window sub-images around GCPs are selected from corrected image and appiled with non-variant moments technique to carry out the precise positions of GCPs in searching area in un-corrected image as mention in section 3. Then, the window sub-image will be applied with whitening fillter based on statistical correlatrion technique.
2. Statistical Correlation Measure
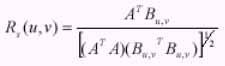
Let f1 and f2 are search and window images that come form the same scene. The elements of f1 (j,k) and f2(j,k) will be highly correlated spatially. So, the conventional correltion measure, it is relatively difficult to distinguish the peak of R(u,v). With the spatially filtering to decorrelate or "whiten", this problem will be removed. Let the column vector Q and P represent the image function f1(j,k) and f2(j,k), repectively, scaned in a vertical raster fashion.
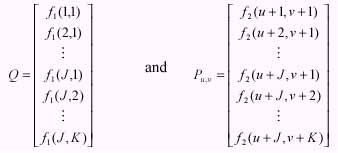
Equation -2
So the whitening filtered images matrix are
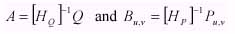
Equation - 3
Equation - 4
Hence,
Equation - 5
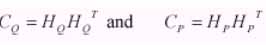
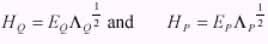
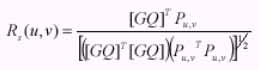
where ?Q and ?P are diagonal matrices containing eigen values along the diagonal, EQ and EP are composed of eigen vactors arranging in corresponding column form on each eigen values in ?Q and ?P The basic correlation operation (eq. 1) is now preformed on the whitened vector A and B, yielding the statistical correlation measure.
Equation - 6
which can be reduced to
Equation - 7
Where

Under the assumption of Markov Process Image, that is , the row and column image elements are assumed to be samples of Markov process (Pratt, 1972). Hence, the image covariance matrix, C is given by
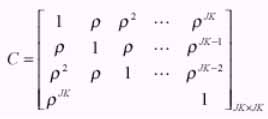
Equation - 8
where JxK is size of window area (Figure 1) and .is the adjacent element correlation. The eigen values and eigen vectors can be found recursively and whitening filter become to (Arcess, 1970):
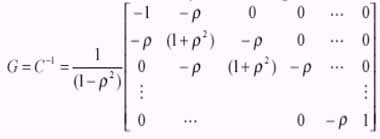
Equation - 9
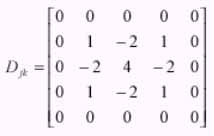
Multiplication of the image vector(Q) by whitening filter (G) is equivalent to convolving the image f1(j,k) with the two dimensional function (Pratt, 1974)
Equation - 10
If the images are complety spatially unrelated, the .= 0. the whitening filter becomes
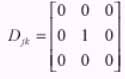
Equation - 11
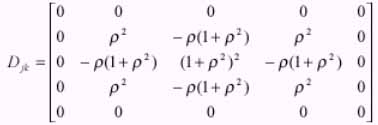
Hence, the statistical measure reduce to the simple correlation measure. At the other extreme, is correlation factor .= 1, thus
Equation - 12
whereas, form as spatial discrete differentiation operation. Thus, while the images are highy correlated, the statistical correlation measure concentrates on the edge outline comparison between the two scenes.
3. AN INVARIANT MOMENTS CONSIDERATION
The 2-D continuous function f(x,y), the moment of order (p+q) is
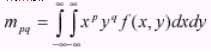
Equation - 13
The central moments is
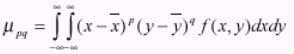
Equation - 14
where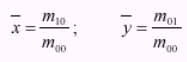
For digital image, the central moments is
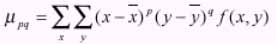
Equation - 15
The 3 order central moments are
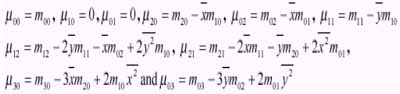
Equation - 16
So, A set of invariant moments is

Equation - 17
4. Geometric Trasformation
The geometric transfoemation in this paper using the bilinear transformation method for image restoration.The image, f is given with pixel coordinates (x,y) undergoes geometric distortion to produce an image g with coordinates (x,y)This transformation can be expressed as follow:
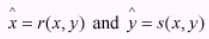
where r(x,y) and s(x,y) repesent the spatial transformation that produced the geometrically corrected image g(x,y) Suppose that the geometric distortion process within the quadrifateral regions is modeled by a pair of bilinear equations. sothat,
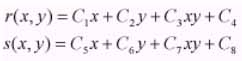
Equation - 18 & 19
The resampling for noninteger value of x and y according to the coefficients Ci will be interferren with bilinear interpolation for gray level interpolation, which can be express as
Equation - 20
5. Example of Geometric Correction with Statistical Correlation Measure Technique based-on Invaraint Moment Criteria
For completly geometric correction, frist step is choosed for searching areas and window areas, where cover on the points as expected tobe ground control point (GCP). Fig 2(a) and 2(b) show full scence OPS image around north of Bangkok which are acquired by JERS-1 on Jan, 29, 1997 and Dec, 10, 1995, respectively. Evenmore, Fig2(b) has been corrected by GICS, image processing system installed in Ladkrabang Ground station and used as reference image.
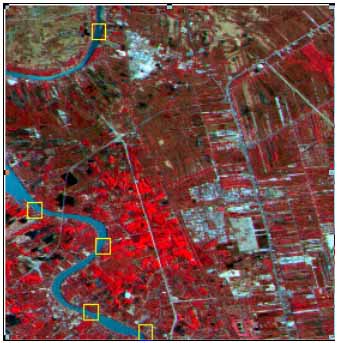
(a) raw data January 29,1997
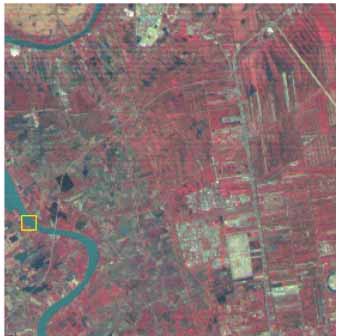
(b) geometric corrected December 10,1995
Figure 2 North of Bangkok OPS images
Figure 3 shows window sub-image, where selected from corrected image (Figure 2b). Whileas, Figure 4 shows corresponding searching area from uncorrected image (Figure 2a) that has almost same correlation value and difficultly distinguish the correct area.

Figure 3 Typical window area
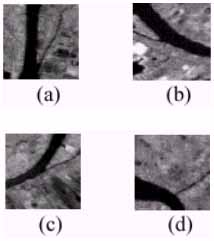
Figure 4 Seaching area with the almost-same correlation value.
Second step, to apply the invaraint moment calculation to such images and the results as shown in table 2. The window image has nearest value with Figure4C. After applying the statistical correlation as mentied before on a pair of sub scence to find out the best-correction point, Rs (u,v) peakes. Figure 5 shows the searching areaes, where are decorrelated by whitening filter (G) with . = 0, 0.5, 0.9 and 1, respectively.
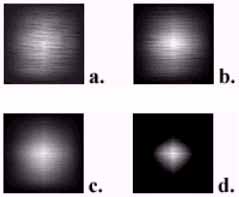
Figure 5 Simulation results of Static correlation measurement with . = 0, 0.5, 0.9 and 1
Figure 5 shows simulation results of correlation measure with . = 0, 0.5, 0.9 and 1. The peak of sub images are referred as ground control points (GCPs) and used for geometric transformation with bilinear technique. The gray level interpolation, then it has been performed with bilinear interpolation in last step and final result of geometric correction has shown in Figure 6.
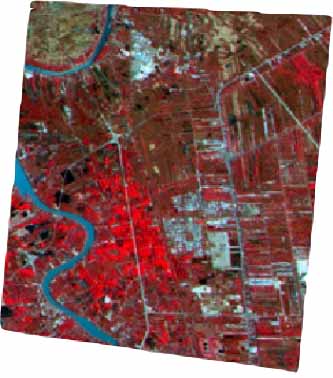
Figure 6 Final result of geometric correction image.
Moment invariants
6. Conclusion
The basic developed correlation shows easierly distinguish the peaks of Rs(u,v) with statistical correlation technique. By using the invaraint moment, it is easy to get rid of the ambiguous same correntlation value. Finally, after re-applying the statistical correlation with the result as Rs(u,v) peaks sharply at the correct point, that bring to the reliable automatically geometic correction based on image to image registation.
Reference
Abstract
The systematic and non-systematic (or random) distortions are major causes of geometric distortion on remote sensing images. The reliableness of all applications usage lay down on geometric correction methods. The precision method is images registration with ground control points, but the assigned GCPs position on the corrupted images with interference noise and burry cloud coverage is difficult and bore some task. Therefore, this paper presents a method to assign automatic GCPs by using image registration method based on sequential similarity detection algorithm (SSDAs) technique, called statistic correlation measurement. The subimage around GCPs are selected and applied with invariant moments method as prototype image to assign a precise positions of GCPs are without translation, rotation and scale change problems. The above sub-images will be applied with whitening filter, that are the results of statistic correlation measurement analysis under the assumption of Markov-process before image registration, geometric transformation and resampling to carry out a precision geometric correction.
1. Introduction
The systematic and non-systematic (or random) distortions are geometric distortion that appear on satellite image and necessary to correct before using. With the ground control points(GCPs), the precision of geometric correction will be done. The corrupted-image with cloud coverage and noise make mapping between GCPs and coincident areas on the image diffculty. To automatic register the sub-image around GCP from the improved image acting as prototype image to assign the positions of GCPs for the improving satellite image, the correlation will also be used in order to obtain the precision and accuracy. The geometric correction process geometrically converts the image coordinates from (x,y) to ) , (y x , where corrected coordinates without geometrical distortion are expressed by ) , (y x and input image corrdinates by (x,y). For Precision geometric correction could be preformed the image to image registration that one image is refered to be the reference image and assumed to be of good quality, i.e., no clound to present, contrast is good and geometrical distortion are negligible. The search (input) image, on the other hand, is relatively unknown quality. Some fog/clound cover may be present along with geometrical distortion. The important issue to achieve such process is the way to select the ground control point (GCP), which should be evident on both images or topographic map, time invariance and spread through out the image. For the sake of two images of the same scene cannot be meaningfully compared. Principal among these are cross-correlation, normalized cross-correlation as shown in eq.1 and minimum distance cirteria (Webber, 1973).
Equation -1
Figure 1. Relationship between search and window areas.
With translation, rotation and scale chane problems, the window sub-images around GCPs are selected from corrected image and appiled with non-variant moments technique to carry out the precise positions of GCPs in searching area in un-corrected image as mention in section 3. Then, the window sub-image will be applied with whitening fillter based on statistical correlatrion technique.
2. Statistical Correlation Measure
Let f1 and f2 are search and window images that come form the same scene. The elements of f1 (j,k) and f2(j,k) will be highly correlated spatially. So, the conventional correltion measure, it is relatively difficult to distinguish the peak of R(u,v). With the spatially filtering to decorrelate or "whiten", this problem will be removed. Let the column vector Q and P represent the image function f1(j,k) and f2(j,k), repectively, scaned in a vertical raster fashion.
Equation -2
So the whitening filtered images matrix are
Equation - 3
Equation - 4
Hence,
Equation - 5
where ?Q and ?P are diagonal matrices containing eigen values along the diagonal, EQ and EP are composed of eigen vactors arranging in corresponding column form on each eigen values in ?Q and ?P The basic correlation operation (eq. 1) is now preformed on the whitened vector A and B, yielding the statistical correlation measure.
Equation - 6
which can be reduced to
Equation - 7
Where
Under the assumption of Markov Process Image, that is , the row and column image elements are assumed to be samples of Markov process (Pratt, 1972). Hence, the image covariance matrix, C is given by
Equation - 8
where JxK is size of window area (Figure 1) and .is the adjacent element correlation. The eigen values and eigen vectors can be found recursively and whitening filter become to (Arcess, 1970):
Equation - 9
Multiplication of the image vector(Q) by whitening filter (G) is equivalent to convolving the image f1(j,k) with the two dimensional function (Pratt, 1974)
Equation - 10
If the images are complety spatially unrelated, the .= 0. the whitening filter becomes
Equation - 11
Hence, the statistical measure reduce to the simple correlation measure. At the other extreme, is correlation factor .= 1, thus
Equation - 12
whereas, form as spatial discrete differentiation operation. Thus, while the images are highy correlated, the statistical correlation measure concentrates on the edge outline comparison between the two scenes.
3. AN INVARIANT MOMENTS CONSIDERATION
The 2-D continuous function f(x,y), the moment of order (p+q) is
Equation - 13
The central moments is
Equation - 14
where
For digital image, the central moments is
Equation - 15
The 3 order central moments are
Equation - 16
So, A set of invariant moments is
Equation - 17
4. Geometric Trasformation
The geometric transfoemation in this paper using the bilinear transformation method for image restoration.The image, f is given with pixel coordinates (x,y) undergoes geometric distortion to produce an image g with coordinates (x,y)This transformation can be expressed as follow:
where r(x,y) and s(x,y) repesent the spatial transformation that produced the geometrically corrected image g(x,y) Suppose that the geometric distortion process within the quadrifateral regions is modeled by a pair of bilinear equations. sothat,
Equation - 18 & 19
The resampling for noninteger value of x and y according to the coefficients Ci will be interferren with bilinear interpolation for gray level interpolation, which can be express as
Equation - 20
5. Example of Geometric Correction with Statistical Correlation Measure Technique based-on Invaraint Moment Criteria
For completly geometric correction, frist step is choosed for searching areas and window areas, where cover on the points as expected tobe ground control point (GCP). Fig 2(a) and 2(b) show full scence OPS image around north of Bangkok which are acquired by JERS-1 on Jan, 29, 1997 and Dec, 10, 1995, respectively. Evenmore, Fig2(b) has been corrected by GICS, image processing system installed in Ladkrabang Ground station and used as reference image.
(a) raw data January 29,1997
(b) geometric corrected December 10,1995
Figure 2 North of Bangkok OPS images
Figure 3 shows window sub-image, where selected from corrected image (Figure 2b). Whileas, Figure 4 shows corresponding searching area from uncorrected image (Figure 2a) that has almost same correlation value and difficultly distinguish the correct area.
Figure 3 Typical window area
Figure 4 Seaching area with the almost-same correlation value.
Second step, to apply the invaraint moment calculation to such images and the results as shown in table 2. The window image has nearest value with Figure4C. After applying the statistical correlation as mentied before on a pair of sub scence to find out the best-correction point, Rs (u,v) peakes. Figure 5 shows the searching areaes, where are decorrelated by whitening filter (G) with . = 0, 0.5, 0.9 and 1, respectively.
Figure 5 Simulation results of Static correlation measurement with . = 0, 0.5, 0.9 and 1
Figure 5 shows simulation results of correlation measure with . = 0, 0.5, 0.9 and 1. The peak of sub images are referred as ground control points (GCPs) and used for geometric transformation with bilinear technique. The gray level interpolation, then it has been performed with bilinear interpolation in last step and final result of geometric correction has shown in Figure 6.
Figure 6 Final result of geometric correction image.
Moment invariants
| Invariant (Log) | Ø1 | Ø2 | Ø3 | Ø4 | Ø5 | Ø6 | Ø7 |
| Figure3 window image | 7.15 | 18.65 | 22.74 | 23.04 | 38.98 | 30.65 | 38.84 |
| Figure 4(a) | 6.14 | 10.71 | 14.36 | 13.42 | 45.35 | 38.36 | 48.95 |
| Figure 4(b) | 5.65 | 23.30 | 16.61 | 17.35 | 33.12 | 40.85 | 32.53 |
| Figure 4(c) | 7.23 | 17.44 | 23.57 | 23.19 | 39.06 | 31.07 | 39.32 |
| Figure 4(d) | 8.36 | 22.81 | 24.06 | 26.37 | 51.17 | 46.14 | 52.91 |
6. Conclusion
The basic developed correlation shows easierly distinguish the peaks of Rs(u,v) with statistical correlation technique. By using the invaraint moment, it is easy to get rid of the ambiguous same correntlation value. Finally, after re-applying the statistical correlation with the result as Rs(u,v) peaks sharply at the correct point, that bring to the reliable automatically geometic correction based on image to image registation.
Reference
- Webber, W.F., 1973. Techniques for Image Registration. IEEE Conf. on Machine Processing ofRemotely Sensed Data, pp. 1B.1 - 1B.7.
- Pratt, W. K., 1974. Correlation Techniques of Image Registration. IEEE Trans.Aerosp. Electron.Syst., Vol AES-10, pp.353-358.
- Arcess, A., Mengert, P.H. and Trombini, E.W., 1970. Image Detection through Bipolar Correlation. IEEE Trans. Information Theory, Vol.IT-16, pp.534-541.
- Gonzalez, R. C. and Woods, R.E., 1993. Digital Image Processing. Addison-Wesley Publishing Company, USA.
- Pratt, W.K., 1972. Generalized Wiener Filtering Computation Techniques. IEEE Trans. Computer, Vol. C-21, pp. 636-641.
- Wisetphanichkij, S., Dejhan, K., Cheevasuvit, F., Mitatha, S., Hanpipatpongsa, S., Pienvijarnpong, C. and Soonyeekan, S., 1998. An Improvement of Geometric Correction of Satellite Image. Proc. of the 19th Asian Conference on Remote Sensing (ACRS'98).