| GISdevelopment.net ---> AARS ---> ACRS 2000 ---> Image Processing |
Some Advanced Techniques for spot 4 XI Data Handling
Nguyen Dinh Duong, Le Kim Thoa, Nguyen Thanh Hoan
Environmental Remote Sensing Laboratory
Institute of Geography, Hoang Quoc Viet Rd., Cau Giay, Hanoi, Vietnam
Phone: 84-4-7562417, Fax: 84-4-8361192, Email: duong.nd@hn.vnn.vn
Keywords: SPOT 4 XI, Land cover, Automated
classification, Color composite
Abstract
The SPOT 4 satellite with short wave infrared band provides a new data source for environmental monitoring and natural resource management. The authors carried out research to develop a new methodology which can fully exploit the advantages of the short wave infrared band. Two issues will be reported in this paper: automated land cover classification and a new color composite model.
The conventional classification methods (supervised or unsupervised) are based on statistical models which use mean vectors, standard deviation and distances such as Euclidean or Mahalannobis as the major classifiers. Different land cover objects have different spectral reflectance properties that can be visualized as a spectral reflectance curve, so it is possible to use this curve as one of the principal measures for classification. The automated classification method developed by the authors uses this spectral reflectance curve along with other quantitative values such as band ratio and band differences for classification. The classification algorithm which is based on graphical analysis of the spectral reflectance curve (GASC) works well with LANDSAT TM data that has 7 spectral bands. SPOT 4 is equipped with a new short wave infrared band at 1.5 mm that provides higher spectral resolution and enhanced sensitivity for leaf moisture content and canopy structure. These improvement is essential for successful application of the GASC algorithm to SPOT 4 XI data in automated classification of land cover. In this paper the authors report on the preliminary results of automated classification using SPOT 4 XI data scene 277/329 acquired on April 24, 2000 near to Hochiminh City, Vietnam.
SPOT 4 XI with 4 spectral bands provides 24 different color composites using the RGB model. Each RGB color composite enhances certain land cover characteristics. However, none of them is capable to display information available in all 4 spectral bands. In this paper the authors report experiment to develop a color composite using all 4 spectral bands. This new color composite is based on data transformation from 4 dimensional conic vector space into 3 dimensional orthogonal space. The transformed components are converted to IHS and RGB space using common algorithms. The new color composite provides more information than any of the conventional ones. The visualized image is an excellent tool for vegetation study and water and infrastructure mapping.
I. Introduction
The SPOT 4 satellite has been launched successfully into orbit on Mar. 24, 1998. From that date the new sensor HRVIR provided new image data for natural resource management and environment monitoring. With new spectral band in short wave infrared region 1.5 - 1.7 mm the HRVIR sensor has broadened application of SPOT data because the SWIR band is particularly sensitive to soil moisture content, vegetation cover and leaf moisture content. The conventional methodology for processing and analysis of multi-spectral remote sensing data, of course, still can be used for SPOT 4 data. However, there is a potential of development of new technique which will help to fully exploit advantages of all four spectral bands of HRVIR sensor. In this paper the authors will present research results on automated classification of land cover and a new color composite model for SPOT 4 XI data. This methodology has been developed in the Environmental Remote Sensing Laboratory, Institute of Geography, Vietnam. SPOT 4 data has been provided by the Satellite Remote Sensing Laboratory, National Central University, Taiwan in the framework of Visiting Scientist Programme.
II. SPOT 4 XI DATA
Image data of SPOT 4 HRVIR is provided in two modes: XS - multispectral mode without SWIR and XI - multispectral mode with SWIR. Depending on processing level, different preprocessing is applied, however, the detector radiometric equalization (MTF enhancement and optional digital dynamic stretching)is always applied for SPOT 4 raw data. Because of variation of ground radiance condition HRVIR sensor applies several gain modes to achieve the best dynamic range of data. Absolute calibration coefficients can be retrieved in the header record of CAP format to compute equivalent radiance at the input of the HRVIR instrument. The gain mode is applied differently for different scenes and different bands of the same scene. This arrangement has caused saturation of image data for some highly reflected objects such as cloud, sand, construction and even bare soil. From this point of view one can expect proper usage of SPOT 4 XI data for interpretation or classification of objects which are not too dark or too bright. Absolute calibration coefficients of some SPOT 4 scenes are shown on Table 1. While gain coefficients for the first three bands are relatively low, band 4 has always very high value of gain coefficient. It is maybe the main reason for digital value saturation of highly reflected objects in band 4. For comparison, digital values of some land cover objects have been read out and shown on Table 2. When compare these values we can see that low reflectance objects
Table 1: Absolute calibration
coefficients
Table 2: Digital values of some land cover objects
such as turbid
or clear water are sensed correctly in dynamic range of one byte integer
for both scenes 277/329 and 278/321. However, due to different gain mode
some saturation occurred for bare soil and sand in scene 277/329 (high
gain mode) while in the scene 278/321 (normal gain mode) they are still in
right values. Cloud is always saturated in all gain modes. Readers should
be noticed that the right dynamic range of SPOT 4 digital values is from 1
to 254. This fact should be taken into consideration in digital processing
SPOT 4 data
III. Automated Classification Of Land Cover Using Spot 4 Hrvir Data
The conventional classification methods (supervised or unsupervised) are based on statistical models which use mean vectors, standard deviation and distances such as Euclidean or Mahalannobis as the major classifiers. Different land cover objects have different spectral reflectance properties that can be visualized as a spectral reflectance curve, so it is possible to use this curve as one of the principal measures for classification (Nguyen Dinh Duong, 1997). The automated classification method developed by the authors uses this spectral reflectance curve along with other quantitative values such as band ratio and band differences for classification. The classification algorithm which is based on graphical analysis of the spectral reflectance curve (GASC) works well with LANDSAT TM data that has 6 spectral bands in visible region. SPOT 4 is equipped with a new short wave infrared band at 1.5 mm that provides higher spectral resolution and enhanced sensitivity for leaf moisture content and canopy structure. These improvement is essential for successful application of the GASC algorithm to SPOT 4 XI data in automated classification of land cover. SPOT 4 XI data of scene 277/329 acquired on April 24, 2000 near to Hochiminh City, Vietnam has been chosen as a study area.
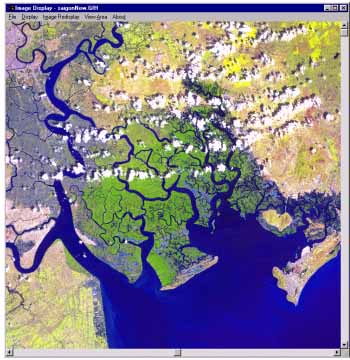
The study area is located in south of Vietnam near to Hochiminh City. Its landscape is dominated by features of coastal zone: mangrove forest, wetland agricultural activities. The scene covers also a part of Mekong river's delta which is well known as area of highly productive rice cultivation. On the upper right quarter of the scene are the famous rubber plantation farms. Hochiminh City is located on the upper left part of the image. Land cover categories are enough diverse for land cover classification. The scene is partly cloudy from the middle towards the top. Standard false color composite of the study area is shown on Figure 1.
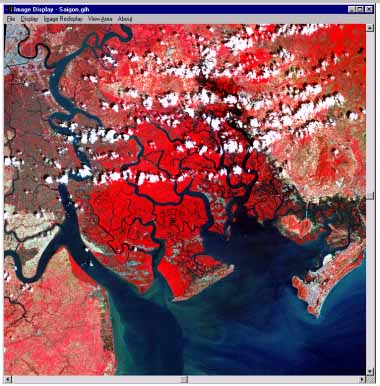
Figure 1. False color composite of the study area
For automated classification a module named as GASC_G07.F90 has been used. This program was developed based on GASC algorithm (Nguyen Dinh Duong 1997, 1998). For this study area a digital legend of 23 land cover categories was developed. In this legend each land cover is described by a set of image invariants (Nguyen Dinh Duong, 2000) composed of: Spectral curve modulation, total reflected radiance index TRRI, band ratios and difference of normalized spectral values. Major land cover categories such as forest, mangrove of different coverage density, rice crop, water body etc. has been automatically extracted using GASC_G07 module. On the Figure 2 is classification result of the study area.
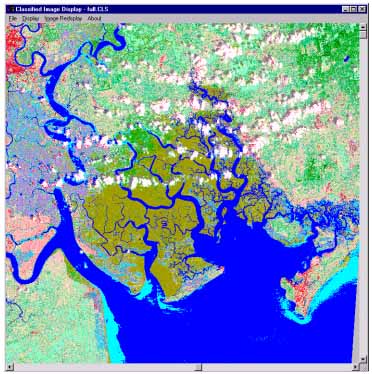
Figure 2. Result of automated land cover classification
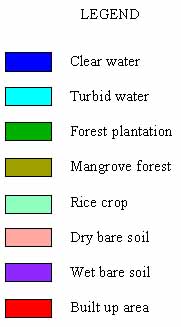
By visual comparison of classification result on the Figure 2 and standard color composite on Figure 1 we can recognize advantages of the proposed approach. Water body is extracted very precisely. Different vegetation types and its distribution has been correctly classified. Mangrove forest, forest plantation (rubber), shrub and grass land including rice crop are possible to be automatically extracted using information derived only from the image data. Bare soil of different level of moisture content is also well identified. Built up area such as urban and housing area is extracted reliably, however, some thin cloud is misclassified into this class. Thick cloud is subject of classification without any doubt, but cloud shadow remains as one of weak point of the GASC algorithm. One of disadvantages of application of different gain modes during observation is needed absolute calibration and working with image data in real number instead integer values which will slow down obviously overall computation performance of the program.
IV. A New Color Composite Model for Spot 4 HRVIR Data
SPOT 4 XI with 4 spectral bands provides 24 different color composites using the RGB model. Each RGB color composite enhances certain land cover characteristics. However, none of them is capable to display information available in all 4 spectral bands. The authors have conducted an experiment to develop a color composite using all 4 spectral bands. This new color composite is based on data transformation from 4 dimensional conic vector space into 3 dimensional orthogonal space.
In general, there is possibility to transform data from n to 3 dimension space. Some degradation of data quality, of course, can be found in the result, however, experiments have confirmed that the visualized transformed data show more information than any of the conventional three band color composites. The transformation can be made using the following equation:
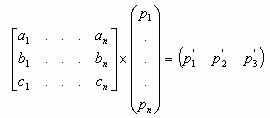
Where pi is original image digital count and p'i is transformed value. The coefficients a1, an, b1, bn, c1, cn can be computed using different transformation model. In this case the authors used 4 dimensional conic vector space to transform data from 4 to 3 dimension space. For the case of SPOT 4 data the transformation is done by the following equation: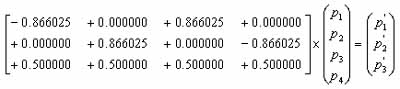
Because the transformed components are in achromatic space so it is necessary to convert them to IHS and RGB space for color visualization. The conversion can be done by any of common HIS-RGB algorithms. The new color composite provides more information than any of the conventional ones. The visualized image is an excellent tool for vegetation study and water and infrastructure mapping. Conversion of transformed components p'i into I,H,S system is done by formulas: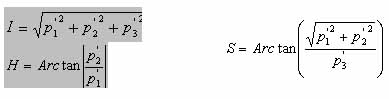
On the Figure 3 is color composite created by this approach. This conversion has been applied for all pixel vectors in the image. Absolute calibration could be applied to ensure stability of the output color. To obtain specifically desired color, some offset of H could be added. When comparing this image with color composite on Figure 1 we could see that the new color composite is much more better than the standard one. When a composite is made by assigning component 1 to blue, component 2 to green and component 3 to red color respectively, vegetation is displayed always in green, water in blue like in true color mode. Therefore the authors has named it as quasi-true color composite. Because of existence of the SWIR band which is not much impacted by atmospheric water vapor and aerosol so the final image is much more clear with higher contrast than the conventional one. Many land cover types such as urban, turbid water, bare soil that have similar color in standard color composite are very easy to be recognized each from other in the new color composite.
V. Conclusion
From this research we could make some conclusions:
- The SPOT 4 XI data with new SWIR band is excellent information source for land cover mapping and environmental research.
- Some saturation is found out in the SWIR band for cloud and bright ground objects. This occurs mostly for image data received in high gain mode.
- The graphical analysis of spectral reflectance curve (GASC) algorithm can be applied for automated classification of SPOT 4 XI data.
- Due to different gain mode of SPOT 4 data, absolute calibration should be applied before classification and image invariant used for digital description of land cover must be computed using absolutely calibrated pixel vector.
- It is possible to create new color composite using all four SPOT 4 XI bands by transformation matrix given in the paper. The visualized image provides more information than the conventional standard color composite and enhances many land cover objects. The new color composite is suitable for vegetation study, water body and infrastructure mapping.
Acknowledgement
The authors would like to acknowledge the Satellite Remote Sensing Laboratory, NCU of Taiwan for providing SPOT 4 data. The authors also thank the Fundamental Research Programme of Vietnam for funding the research.
Reference
Abstract
The SPOT 4 satellite with short wave infrared band provides a new data source for environmental monitoring and natural resource management. The authors carried out research to develop a new methodology which can fully exploit the advantages of the short wave infrared band. Two issues will be reported in this paper: automated land cover classification and a new color composite model.
The conventional classification methods (supervised or unsupervised) are based on statistical models which use mean vectors, standard deviation and distances such as Euclidean or Mahalannobis as the major classifiers. Different land cover objects have different spectral reflectance properties that can be visualized as a spectral reflectance curve, so it is possible to use this curve as one of the principal measures for classification. The automated classification method developed by the authors uses this spectral reflectance curve along with other quantitative values such as band ratio and band differences for classification. The classification algorithm which is based on graphical analysis of the spectral reflectance curve (GASC) works well with LANDSAT TM data that has 7 spectral bands. SPOT 4 is equipped with a new short wave infrared band at 1.5 mm that provides higher spectral resolution and enhanced sensitivity for leaf moisture content and canopy structure. These improvement is essential for successful application of the GASC algorithm to SPOT 4 XI data in automated classification of land cover. In this paper the authors report on the preliminary results of automated classification using SPOT 4 XI data scene 277/329 acquired on April 24, 2000 near to Hochiminh City, Vietnam.
SPOT 4 XI with 4 spectral bands provides 24 different color composites using the RGB model. Each RGB color composite enhances certain land cover characteristics. However, none of them is capable to display information available in all 4 spectral bands. In this paper the authors report experiment to develop a color composite using all 4 spectral bands. This new color composite is based on data transformation from 4 dimensional conic vector space into 3 dimensional orthogonal space. The transformed components are converted to IHS and RGB space using common algorithms. The new color composite provides more information than any of the conventional ones. The visualized image is an excellent tool for vegetation study and water and infrastructure mapping.
I. Introduction
The SPOT 4 satellite has been launched successfully into orbit on Mar. 24, 1998. From that date the new sensor HRVIR provided new image data for natural resource management and environment monitoring. With new spectral band in short wave infrared region 1.5 - 1.7 mm the HRVIR sensor has broadened application of SPOT data because the SWIR band is particularly sensitive to soil moisture content, vegetation cover and leaf moisture content. The conventional methodology for processing and analysis of multi-spectral remote sensing data, of course, still can be used for SPOT 4 data. However, there is a potential of development of new technique which will help to fully exploit advantages of all four spectral bands of HRVIR sensor. In this paper the authors will present research results on automated classification of land cover and a new color composite model for SPOT 4 XI data. This methodology has been developed in the Environmental Remote Sensing Laboratory, Institute of Geography, Vietnam. SPOT 4 data has been provided by the Satellite Remote Sensing Laboratory, National Central University, Taiwan in the framework of Visiting Scientist Programme.
II. SPOT 4 XI DATA
Image data of SPOT 4 HRVIR is provided in two modes: XS - multispectral mode without SWIR and XI - multispectral mode with SWIR. Depending on processing level, different preprocessing is applied, however, the detector radiometric equalization (MTF enhancement and optional digital dynamic stretching)is always applied for SPOT 4 raw data. Because of variation of ground radiance condition HRVIR sensor applies several gain modes to achieve the best dynamic range of data. Absolute calibration coefficients can be retrieved in the header record of CAP format to compute equivalent radiance at the input of the HRVIR instrument. The gain mode is applied differently for different scenes and different bands of the same scene. This arrangement has caused saturation of image data for some highly reflected objects such as cloud, sand, construction and even bare soil. From this point of view one can expect proper usage of SPOT 4 XI data for interpretation or classification of objects which are not too dark or too bright. Absolute calibration coefficients of some SPOT 4 scenes are shown on Table 1. While gain coefficients for the first three bands are relatively low, band 4 has always very high value of gain coefficient. It is maybe the main reason for digital value saturation of highly reflected objects in band 4. For comparison, digital values of some land cover objects have been read out and shown on Table 2. When compare these values we can see that low reflectance objects
| Scene number | Gain/offset | |||
| Band 1 | Band 2 | Band 3 | Band 4 | |
| 277/329 2000/03/01 |
1.93500 / 0.0 | 2.28786 / 0.0 | 2.45268 / 0.0 | 13.31878 / 0.0 |
| 278/321 2000/04/22 |
1.29258 / 0.0 | 1.01000 / 0.0 | 1.08000 / 0.0 | 8.79000 / 0.0 |
| 278/320 2000/04/22 |
1.29258 / 0.0 | 1.01000 / 0.0 | 1.08000 / 0.0 | 8.79000 / 0.0 |
Table 2: Digital values of some land cover objects
| Objects | Scene 277/329 | Scene 278/321 | ||||||
| Band 1 | Band 2 | Band 3 | Band 4 | Band 1 | Band 2 | Band 3 | Band 4 | |
| Cloud | 254 | 254 | 254 | 254 | 254 | 254 | 168 | 207 |
| Sand | 215 | 254 | 199 | 254 | 133 | 150 | 74 | 139 |
| Bare soil | 170 | 198 | 133 | 254 | 178 | 214 | 112 | 186 |
| Turbid water | 96 | 96 | 33 | 17 | 94 | 87 | 20 | 28 |
| Clear water | 67 | 48 | 24 | 33 | 54 | 36 | 8 | 17 |
III. Automated Classification Of Land Cover Using Spot 4 Hrvir Data
The conventional classification methods (supervised or unsupervised) are based on statistical models which use mean vectors, standard deviation and distances such as Euclidean or Mahalannobis as the major classifiers. Different land cover objects have different spectral reflectance properties that can be visualized as a spectral reflectance curve, so it is possible to use this curve as one of the principal measures for classification (Nguyen Dinh Duong, 1997). The automated classification method developed by the authors uses this spectral reflectance curve along with other quantitative values such as band ratio and band differences for classification. The classification algorithm which is based on graphical analysis of the spectral reflectance curve (GASC) works well with LANDSAT TM data that has 6 spectral bands in visible region. SPOT 4 is equipped with a new short wave infrared band at 1.5 mm that provides higher spectral resolution and enhanced sensitivity for leaf moisture content and canopy structure. These improvement is essential for successful application of the GASC algorithm to SPOT 4 XI data in automated classification of land cover. SPOT 4 XI data of scene 277/329 acquired on April 24, 2000 near to Hochiminh City, Vietnam has been chosen as a study area.
The study area is located in south of Vietnam near to Hochiminh City. Its landscape is dominated by features of coastal zone: mangrove forest, wetland agricultural activities. The scene covers also a part of Mekong river's delta which is well known as area of highly productive rice cultivation. On the upper right quarter of the scene are the famous rubber plantation farms. Hochiminh City is located on the upper left part of the image. Land cover categories are enough diverse for land cover classification. The scene is partly cloudy from the middle towards the top. Standard false color composite of the study area is shown on Figure 1.
Figure 1. False color composite of the study area
For automated classification a module named as GASC_G07.F90 has been used. This program was developed based on GASC algorithm (Nguyen Dinh Duong 1997, 1998). For this study area a digital legend of 23 land cover categories was developed. In this legend each land cover is described by a set of image invariants (Nguyen Dinh Duong, 2000) composed of: Spectral curve modulation, total reflected radiance index TRRI, band ratios and difference of normalized spectral values. Major land cover categories such as forest, mangrove of different coverage density, rice crop, water body etc. has been automatically extracted using GASC_G07 module. On the Figure 2 is classification result of the study area.
Figure 2. Result of automated land cover classification
By visual comparison of classification result on the Figure 2 and standard color composite on Figure 1 we can recognize advantages of the proposed approach. Water body is extracted very precisely. Different vegetation types and its distribution has been correctly classified. Mangrove forest, forest plantation (rubber), shrub and grass land including rice crop are possible to be automatically extracted using information derived only from the image data. Bare soil of different level of moisture content is also well identified. Built up area such as urban and housing area is extracted reliably, however, some thin cloud is misclassified into this class. Thick cloud is subject of classification without any doubt, but cloud shadow remains as one of weak point of the GASC algorithm. One of disadvantages of application of different gain modes during observation is needed absolute calibration and working with image data in real number instead integer values which will slow down obviously overall computation performance of the program.
IV. A New Color Composite Model for Spot 4 HRVIR Data
SPOT 4 XI with 4 spectral bands provides 24 different color composites using the RGB model. Each RGB color composite enhances certain land cover characteristics. However, none of them is capable to display information available in all 4 spectral bands. The authors have conducted an experiment to develop a color composite using all 4 spectral bands. This new color composite is based on data transformation from 4 dimensional conic vector space into 3 dimensional orthogonal space.
In general, there is possibility to transform data from n to 3 dimension space. Some degradation of data quality, of course, can be found in the result, however, experiments have confirmed that the visualized transformed data show more information than any of the conventional three band color composites. The transformation can be made using the following equation:
Where pi is original image digital count and p'i is transformed value. The coefficients a1, an, b1, bn, c1, cn can be computed using different transformation model. In this case the authors used 4 dimensional conic vector space to transform data from 4 to 3 dimension space. For the case of SPOT 4 data the transformation is done by the following equation:
Because the transformed components are in achromatic space so it is necessary to convert them to IHS and RGB space for color visualization. The conversion can be done by any of common HIS-RGB algorithms. The new color composite provides more information than any of the conventional ones. The visualized image is an excellent tool for vegetation study and water and infrastructure mapping. Conversion of transformed components p'i into I,H,S system is done by formulas:
On the Figure 3 is color composite created by this approach. This conversion has been applied for all pixel vectors in the image. Absolute calibration could be applied to ensure stability of the output color. To obtain specifically desired color, some offset of H could be added. When comparing this image with color composite on Figure 1 we could see that the new color composite is much more better than the standard one. When a composite is made by assigning component 1 to blue, component 2 to green and component 3 to red color respectively, vegetation is displayed always in green, water in blue like in true color mode. Therefore the authors has named it as quasi-true color composite. Because of existence of the SWIR band which is not much impacted by atmospheric water vapor and aerosol so the final image is much more clear with higher contrast than the conventional one. Many land cover types such as urban, turbid water, bare soil that have similar color in standard color composite are very easy to be recognized each from other in the new color composite.
V. Conclusion
From this research we could make some conclusions:
- The SPOT 4 XI data with new SWIR band is excellent information source for land cover mapping and environmental research.
- Some saturation is found out in the SWIR band for cloud and bright ground objects. This occurs mostly for image data received in high gain mode.
- The graphical analysis of spectral reflectance curve (GASC) algorithm can be applied for automated classification of SPOT 4 XI data.
- Due to different gain mode of SPOT 4 data, absolute calibration should be applied before classification and image invariant used for digital description of land cover must be computed using absolutely calibrated pixel vector.
- It is possible to create new color composite using all four SPOT 4 XI bands by transformation matrix given in the paper. The visualized image provides more information than the conventional standard color composite and enhances many land cover objects. The new color composite is suitable for vegetation study, water body and infrastructure mapping.
Acknowledgement
The authors would like to acknowledge the Satellite Remote Sensing Laboratory, NCU of Taiwan for providing SPOT 4 data. The authors also thank the Fundamental Research Programme of Vietnam for funding the research.
Reference
- SPOT IMAGE: The SPOT Scene Standard Digital Product Format S4-ST-73=01-SI
- Nguyen Dinh Duong. Graphical Analysis of Spectral Reflectance Curve. Proceedings of the 18th Asian Conference on Remote Sensing. 20 - 24 October 1997, Kualalumpur Malaysia.
- Nguyen Dinh Duong. Total Reflected Radiance Index- An Index to Support Land Cover Classification. Proceedings of the 19th Asian Conference on Remote Sensing. 16 - 20 November 1998, Manila, Philippines
- Nguyen Dinh Duong. Land Cover Category Definition by Image Invariants for Automated Classification. International Archives of Photogrammetry and Remote Sensing. Vol. XXXIII, Part B7/3, Commission VII. ISPRS 2000 Amsterdam, the Netherlands.