| GISdevelopment.net ---> AARS ---> ACRS 2000 ---> Image Processing |
Comparative study on model
fitting methods for object extraction
Masafumi NAKAGAWA, Huijing ZHAO, Ryosuke SHIBASAKI
Graduate School of Frontier Sciences, Shibasaki lab.
University of Tokyo
4-6-1 Komaba, Meguro-ku, Tokyo, 153-8505 JAPAN
Tel: (81)-3-5452-6417 Fax: (81)-3-5452-6417
E-mail:mnaka@iis.u-tokyo.ac.jp
Masafumi NAKAGAWA, Huijing ZHAO, Ryosuke SHIBASAKI
Graduate School of Frontier Sciences, Shibasaki lab.
University of Tokyo
4-6-1 Komaba, Meguro-ku, Tokyo, 153-8505 JAPAN
Tel: (81)-3-5452-6417 Fax: (81)-3-5452-6417
E-mail:mnaka@iis.u-tokyo.ac.jp
Keywords: SNAKE, Fitting, High resolution image, Residential maps update
Abstract
It is expected that spatial data with various forms and content will be used in city in the future. It is advantageous to integrate various source data to generate urban spatial information. For instance, laser scanner has only limited resolution, though it can acquire three dimensional data directly. On the other hand, CCD image has very high resolution and conveys useful information for recognizing object though stereo matching methods are necessary for the extraction of 3D shape and the reliability is not sufficiently high for the automation. The integration of laser scanner and CCD sensor may enable to automate three dimensional spatial data generation with high resolution.
Model fitting methods attract attention as a method of integrating various sensor data for object recognition. The model fitting methods usually prepare models which describe the characteristics of the object with several parameters to generate a hypothesis, and selects a model which maximizes the agreement to obtained multi-sensor data, and simultaneously decides the parameter values of the model. However, enough examination is not performed on the characteristics of various model fitting methods, though a variety of methods are proposed in terms of the definition of an objective function necessary for deciding the model parameter and those of constraint conditions.
In this research, the building extraction from the high-resolution satellite image was assumed to be an example, and the techniques of the model fitting were compared under different conditions in terms of accuracy and reliability, etc.
1 Introduction
Model fitting methods attract attention as a technique to extract an object from various data of the image etc. The model fitting methods usually apply models which describe the characteristics (e.g. shape, texture) of the object with several parameters to generate a hypothesis, and selects a model which maximizes the agreement to obtained multi-sensor data, and simultaneously decides the parameter values of the model. However, enough examination is not performed on their characteristics of various model fitting methods, though a variety of methods are proposed in terms of the definition of an objective function necessary for deciding the model parameter and those of constraint conditions.
The purpose of this paper is to compare and to characterize model fitting methods ay applying them to high-resolution satellite image data to extract building outline. Success rate of extracting the building outline is used as an indicator.
First of all, the building samples in an urban area are chosen in this image, and those samples are classified into two classes; buildings that can be extracted successfully and the other that fail to be extracted (Chapter 2). For the buildings that cannot be easily extracted, the initial model position/shape is changed so that the initial value dependency of the fitting results can be analyzed (Chapter 3). In addition, range of parameter values which make model fitting succeed is searched for by changing the parameter and forms of the energy function and the constraint conditions of SNAKE, and generality of the sensitibity analysis is examined.
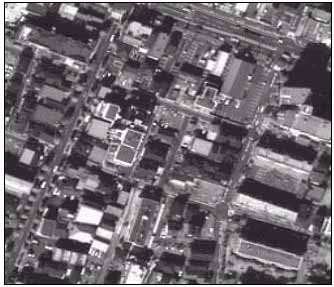
1-1 Test data
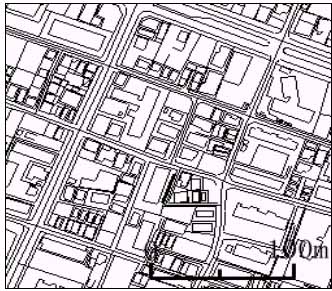
In this research, high-resolution satellite image (IKONOS) and the existing residential maps (Zenrin Map; vector data) of Kobe City are used. This is a typical case with the urban area in Japan.
- Figure 1-2: Zenrin Map-
1-2 SNAKE
Here, Polygonal SNAKE which one of the authors proposed based on [Fua 1996] is used. SNAKE is initialized at first by using the map data. Next, each line is moved in parallel to maximize the average of edge intensity along SNAKE lines. The edge intensity is defined as a cross-sectional gradient of the gray value of the edge-enhanced image. The following functions are used for SNAKE.

Einternal ; Paragraph that Internal energy is evaluated
Eexternal ; Paragraph that External energy is evaluated
w1 ; Weight of internal energy w2 ; Weight of external energy
w1 =1.000000 and w2=0.250000 are set from the experience as default value. Besides this, it is set as Scale Space=5 and Search Segment Number=5, and assumed default value. Scale space is distance between SNAKE's points. And Search Segment Number is range where SNAKE searchs optimum point. Basically, the fitting is done by these values. These parameter values are changed when the fitting fail with the default value, and the value which the fitting success is recorded.
1-3 Evaluation of fitting errors
Quantitative evaluation of the fitting errors was not made because the purpose of this study is to identify conditions affecting the success or failure of the model fitting. The success or failure is determined by visual inspection.
2 Experiment of model fitting (SNAKE) using existing map data as an initial value
Building in dense urban areas are chosen as samples, and the model fitting (SNAKE) using an existing map to set up initial models is conducted. IKONOS image was geocoded to overlay with the existing 1/2500 digital maps. Example results of the fitting experiment are shown in Figure 1-3~Figures 1-7. Factors greatly affecting the fitting success in the experiment are summarized as follows.
- Distance between initial location/shape of the model and edge location in the image
- Contrast or intensity of the edge
- Three dimensional complexities of buildings
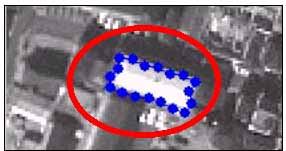
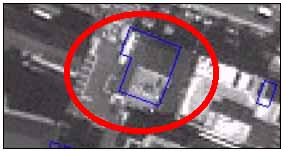
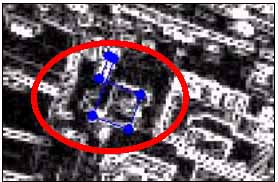
The building whose shape and position in the existing map agree well to edges in the image have higher rate of success of the fitting. Figure 2-1 shows typical examples. On the other hands, the fitting fails for a rebuilt building as shown in Figure 2-2, which suggests that newly built buildings after a building is demolished can be detected. Here, it can be concluded that agreement of the shape and the position of existing building boundary data and the image is important for the model fitting, though further experiments are needed for the quantitative evaluation. Since the IKONOS image used in this research is an oblique image, the height of the building has caused horizontal shift of the building boundary data which results in the failure of the model fitting.
In the following figures, the existing residential map data is drawn by blue line, the result of processing with SNAKE is drawn by blue line connected in a blue point.
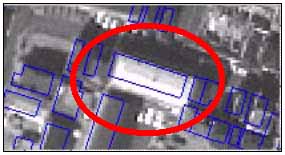
-Figure 2-2: initial value and image: failure example-
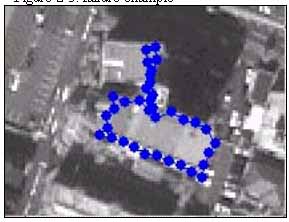
If buildings have edges with good contrast and connectivity in the edge image, model fitting tend to succeed. On the other hands, it is likely that the model fitting fail for the buildings where the edge contrast is low and the connectivity of the edge is poor. Especially, when there are trees adjacent to the building or shadow on north side of building, they are recognized as parts of the building, and SNAKE edges tend to be caught by those other edges. However, there is a tendency that a good result is obtained easily when roof color is white. It is due to stronger contrast of white roofs to building shadow and ground color. In addition, the experiment suggests that distance to the adjacent buildings also influences. Figure 2-3 and Figure 2-4 show the edge map in the building in Figure 2-1 and Figure 2-2. When the edge contrast and connectivity is good, SNAKE edge can follow neatly along the edge.
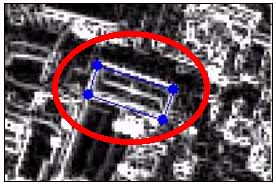
- Figure 2-4: edge image: Poor contrast and connectivity-
2-3 Three dimensional complexity
In case of deck, model fitting usually succeed, because the roof has homogenous color, while gable roofs may not be successfully extracted, because north side of the roof are regarded as the shadow of the buildings.
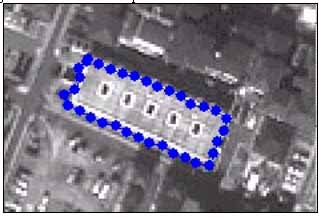
In case of a building consisting of different structures (composite building), the height of the building roof is not homogenous, which generate edges with complicated shapes not consistent with the building boundary data in 2D maps. Typical success and the failure example are shown in Figure 2-5 and Figure 2-6.
-Figure 2-6: success example-
2-4 Iteration number
It was examined whether there is a correlation between success/failure of the fitting and iteration number. Iteration number is total times that points move with SNAKE.
When targeted building is quadrangle (node number is 4), there is a tendency that the fitting succeeds if the iteration number is ten or less, but there is a tendency that the fitting fails when it was a lot of from ten. This value might be helpful in the classification of the success or the failure o the fitting.
3 Dependency on initial values
Especially, for the building where the fitting does not succeed in Chapter 2, the initial value in terms of the distance with "Correct answer" is changed to see how or whether the fitting results fail. Thus the initial value dependency of the fitting result is analyzed. Here, the initial value of the vector data is recreated along the rooftop side on the building in the IKONOS image.
Moreover, the similar procedure is applied to the buildings not recorded in the existing residential maps, that is, new buildings. As for SNAKE, the initial value dependency is thought to be high as a result. The following two examples are typical examples of showing the dependency.
3-1 For edge map
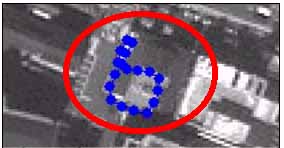
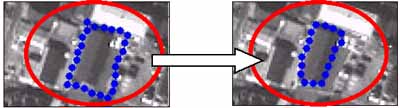
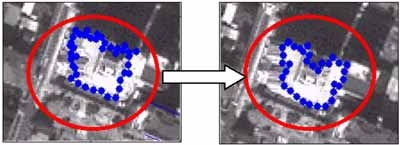
If the initial value is not appropriate, the fitting does not often succeed. When the building is overcrowded or the trees are grown in surroundings, SNAKE is pulled to the edge of surrounding features. However, when the initial value is given on the outline in the building again, a good result is obtained. Figure 3-1 shows an example of giving the initial value, and the success in the fitting.
 | |
| -The first fitting results- | -Second fitting trial by changing the initial values- |
3-2 For high building
An oblique photograph caused the shift in the location of the building roof shape. The fitting is able to have done well when there is a difference in the color of the wall and the rooftop.
Oppositely, when the color of the wall and the rooftop are almost the same, the fitting usually fails. It is thought that this is due to the poor contrast. So, when the entire wall is shadowed, the fitting can succeed. Figure 3-2 shows horizontal displacement of the initial value, and the example of the success of the fitting changing the initial value.
 | |
| -The first fitting results- | -Second fitting trial by changing the initial values- |
4 Change in parameter values of energy function
By changing the parameters of the energy equation of SNAKE, more appropriate values or range of values are searched for so that SNAKE can fit the feature better.
For the cases where the fitting failed by the method of Chapter 2 and Chapter 3, the values of parameter ?1 and ?2 of the energy equation (equation 1) are changed. By monitoring the relation of these parameter and the movement of SNAKE in changing the parameter values, a suitable value is examined for the fitting. Moreover, the value of the parameter obtained for this research is inputted to the energy equation again to see the behavior of Snake for the building cases in Chapter 2. Detailed results will be reported in the conference.
5 Conclusions
In this research, it is examined through numerical experiments what conditions are preferable for the success and can cause the failure of the fitting taking the building model and using the high-resolution satellite image as examples.
The conditions are summarized as follows;
·Accurate initial values (map data).
·Clear edge image.
Especially, it is understood that the result of the fitting changes greatly depending on the initial values. The presence of a strong peripheral edge is important for the success of the fitting, too. However, there is room for conducting more quantitative analysis on the influences of the initial values. These results suggest the following procedure of applying SNAKE for revising spatial database using aerial or space images.
First of all, the model fitting is done using the out-of-dated digital map; The initial value is inputted for the one not having succeeded, and the fitting of the model can be tried again; For the one failed again, detailed vector data is made manually; It is thought that an automation and efficiency improvement can be achieved by depending on a series of work like these for the extraction of the building outline.
If an appropriate edge map etc. are made, updating the existing residential maps data will become easier, though it is still problematic to find the building which should be renewed.
References
- MICHAEL KASS, ANDREW WITKIN, and DEMETRI TERZOPOULOS, 1988. Snakes (Active Contour Models). International Journal of Computer Vision, pp321-331.