| GISdevelopment.net ---> AARS ---> ACRS 2000 ---> Image Processing |
Accuracy Improvement of the
Land Cover Classification by using Truncated Normal Distribution
Tsukasa Hosomura (Japan)
Professor, Department of Information and Arts
Tokyo Denki University
Ishizaka, Hatoyama-machi, Hiki-gun, Saitama , 350-0394
Tel: +81-492-96-2911, Fax: +81-492-96-5311,
E-mail:hosomura@ia.dendai.ac.jp
Tsukasa Hosomura (Japan)
Professor, Department of Information and Arts
Tokyo Denki University
Ishizaka, Hatoyama-machi, Hiki-gun, Saitama , 350-0394
Tel: +81-492-96-2911, Fax: +81-492-96-5311,
E-mail:hosomura@ia.dendai.ac.jp
Keywords: fused image, test site, verification
Abstract
In this paper, in order to improve the classification accuracy training data screening and truncated normal distribution maximum likelihood classification are adopted. We verify these techniques are effective measures for the improvement in the classification accuracy.
1. Introduction
Generally classified result is changed by how to get the training data in the land cover classification using unsupervised algorithm. As the training data are extracted by the human interpretation, pixels including errors are extracted. Therefore, it becomes the classification accuracy lower. By removing the extracted pixels including errors, the classification accuracy will be improved. The normal distribution is assumed for the distribution of each class in the maximum likelihood classification. But actual distribution is different from normal distribution. The misclassification decreases by removing the tail of each class in which the misclassification seems to increase, and the classification accuracy will be improved. In this paper, in order to improve the classification accuracy training data screening and truncated normal distribution maximum likelihood classification are adopted. We verify these techniques are effective measures for the improvement in the classification accuracy. The distribution profile of training data is examined. Probability density function of each class is recalculated after removing the tail of each distribution. In other words, the distribution with large standard deviation converts into small distribution profile. Instead of the normal distribution in the case of maximum likelihood method, truncated normal distribution is used in truncated normal distribution maximum likelihood classification. Classification accuracy will be calculated by comparing test site data and classified result. As a result of the experiment, it is confirmed that screening of training data and truncated normal distribution maximum likelihood classification are effective measures for the classification accuracy improvement.
2. The screening of the training data
With the screening of the training data, the distribution profile of normalized training data is examined, and probability density function is recalculated after excluding the pixels, which cause misclassification. There are two methods for screening.
(1) The pixel was removed when pixel value exist in the tail of training data distribution at least one band.
(2) The pixel is removed when pixel value exist in the tail of training data distribution at all bands
3. Maximum likelihood classification using the truncated normal distribution
3.1 Outline of the truncated normal distribution
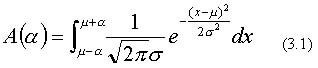
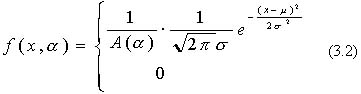
Truncated normal distribution is made from normal distribution by truncating the tail of the distribution. The probability distribution function of truncated normal distribution is defined in equation (3.2) using A(a) of following equation (3.1).
4. Experiments
Object image used in this study is fused image of panchromatic image of SPOT and 2,3,4 band of Landsat/TM. The classification was carried out in 50 classes, and each category was finally integrated to 7 classes, housing area, grassland, paddy field, coniferous forest, bare ground, water body and shadow.
4.1 Maximum likelihood classification using truncated normal distribution
The range of (µ - 2s, µ +2 s, µ: mean value, s: standard deviation) in normal distribution contains about 95%. Normal distribution was truncated in this range. Truncated normal distribution was created.
4.2 Maximum likelihood classification by the screening of the training data
There are two following types for the screening of the training data
The pixel was removed when pixel value exist in the tail of training data distribution at least one band.
The pixel is removed when pixel value exist in the tail of training data distribution at all bands
In this study, screening object is made to be the data in which the data does not come in within (µ - 2s, µ +2 s, µ: mean value, s: Standard deviation ) in each class. Maximum likelihood classification was implemented by using screening ? and screening ?.
4.3 Maximum likelihood classification using the both methods
Classification accuracy using both methods of the maximum likelihood classification of the training data using screening and truncated normal distribution proposed in this paper.
5. Result
Standard classification accuracy must be prepared to confirm the improvement of classification accuracy. Multisensor fusion image of the Landsat/TM 3 bands and SPOT panchromatic image was used. The maximum likelihood classification result for this image is used as the standard classification accuracy. The classification result is shown in Table 1.
Table 1 Accuracy of classification
result
As a result of the experiment, classification using both methods obtained the highest classification accuracy compared with independently used method. And, there was seldom undiscriminant pixel. There was no category where the classification accuracy became 10% or less on the each classification category.
6. Conclusion
The screening of training data and maximum likelihood classification using truncated normal distribution, which are techniques of the classification accuracy improvement proposed in this paper, improve classification accuracy. Especially the latter is good method for reducing number of pixels in the undiscriminant class. It also improves the classification accuracy more. It is effective measures for the classification accuracy improvement. And the technique by using both methods improves classification accuracy evidently. In this paper, satellite image of 3 bands of the 30m resolutions was used as object image. If the object image is different from the image used in this experiment, obtained result will be changed. Therefore, we should verify another case, for example different sensor, different time, different resolution and so on.
Abstract
In this paper, in order to improve the classification accuracy training data screening and truncated normal distribution maximum likelihood classification are adopted. We verify these techniques are effective measures for the improvement in the classification accuracy.
1. Introduction
Generally classified result is changed by how to get the training data in the land cover classification using unsupervised algorithm. As the training data are extracted by the human interpretation, pixels including errors are extracted. Therefore, it becomes the classification accuracy lower. By removing the extracted pixels including errors, the classification accuracy will be improved. The normal distribution is assumed for the distribution of each class in the maximum likelihood classification. But actual distribution is different from normal distribution. The misclassification decreases by removing the tail of each class in which the misclassification seems to increase, and the classification accuracy will be improved. In this paper, in order to improve the classification accuracy training data screening and truncated normal distribution maximum likelihood classification are adopted. We verify these techniques are effective measures for the improvement in the classification accuracy. The distribution profile of training data is examined. Probability density function of each class is recalculated after removing the tail of each distribution. In other words, the distribution with large standard deviation converts into small distribution profile. Instead of the normal distribution in the case of maximum likelihood method, truncated normal distribution is used in truncated normal distribution maximum likelihood classification. Classification accuracy will be calculated by comparing test site data and classified result. As a result of the experiment, it is confirmed that screening of training data and truncated normal distribution maximum likelihood classification are effective measures for the classification accuracy improvement.
2. The screening of the training data
With the screening of the training data, the distribution profile of normalized training data is examined, and probability density function is recalculated after excluding the pixels, which cause misclassification. There are two methods for screening.
(1) The pixel was removed when pixel value exist in the tail of training data distribution at least one band.
(2) The pixel is removed when pixel value exist in the tail of training data distribution at all bands
3. Maximum likelihood classification using the truncated normal distribution
3.1 Outline of the truncated normal distribution
Truncated normal distribution is made from normal distribution by truncating the tail of the distribution. The probability distribution function of truncated normal distribution is defined in equation (3.2) using A(a) of following equation (3.1).
4. Experiments
Object image used in this study is fused image of panchromatic image of SPOT and 2,3,4 band of Landsat/TM. The classification was carried out in 50 classes, and each category was finally integrated to 7 classes, housing area, grassland, paddy field, coniferous forest, bare ground, water body and shadow.
4.1 Maximum likelihood classification using truncated normal distribution
The range of (µ - 2s, µ +2 s, µ: mean value, s: standard deviation) in normal distribution contains about 95%. Normal distribution was truncated in this range. Truncated normal distribution was created.
4.2 Maximum likelihood classification by the screening of the training data
There are two following types for the screening of the training data
The pixel was removed when pixel value exist in the tail of training data distribution at least one band.
The pixel is removed when pixel value exist in the tail of training data distribution at all bands
In this study, screening object is made to be the data in which the data does not come in within (µ - 2s, µ +2 s, µ: mean value, s: Standard deviation ) in each class. Maximum likelihood classification was implemented by using screening ? and screening ?.
4.3 Maximum likelihood classification using the both methods
Classification accuracy using both methods of the maximum likelihood classification of the training data using screening and truncated normal distribution proposed in this paper.
5. Result
Standard classification accuracy must be prepared to confirm the improvement of classification accuracy. Multisensor fusion image of the Landsat/TM 3 bands and SPOT panchromatic image was used. The maximum likelihood classification result for this image is used as the standard classification accuracy. The classification result is shown in Table 1.
| Maximum likelihood classification | 59.0% |
| Truncated normal distribution classification | 75.1% |
| Screening ? | 60.9% |
| Screening ? | 62.7% |
| Classification accuracy using both methods | 76.1%. |
As a result of the experiment, classification using both methods obtained the highest classification accuracy compared with independently used method. And, there was seldom undiscriminant pixel. There was no category where the classification accuracy became 10% or less on the each classification category.
6. Conclusion
The screening of training data and maximum likelihood classification using truncated normal distribution, which are techniques of the classification accuracy improvement proposed in this paper, improve classification accuracy. Especially the latter is good method for reducing number of pixels in the undiscriminant class. It also improves the classification accuracy more. It is effective measures for the classification accuracy improvement. And the technique by using both methods improves classification accuracy evidently. In this paper, satellite image of 3 bands of the 30m resolutions was used as object image. If the object image is different from the image used in this experiment, obtained result will be changed. Therefore, we should verify another case, for example different sensor, different time, different resolution and so on.